Cypriot vs Immigrants from Congo Poverty
COMPARE
Cypriot
Immigrants from Congo
Poverty
Poverty Comparison
Cypriots
Immigrants from Congo
10.8%
POVERTY
99.3/ 100
METRIC RATING
36th/ 347
METRIC RANK
16.1%
POVERTY
0.0/ 100
METRIC RATING
319th/ 347
METRIC RANK
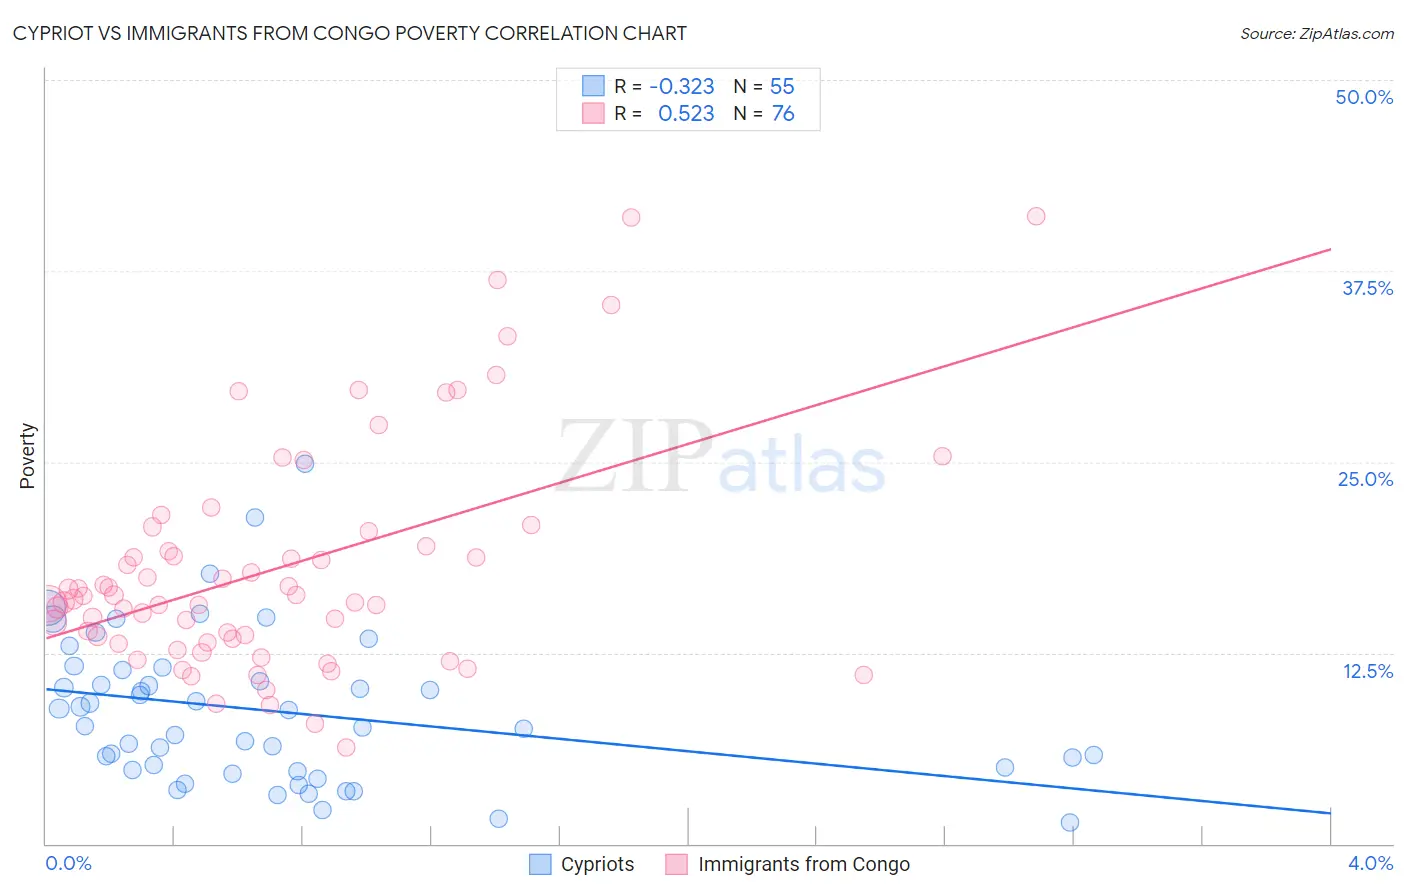
Cypriot vs Immigrants from Congo Poverty Correlation Chart
The statistical analysis conducted on geographies consisting of 61,850,194 people shows a mild negative correlation between the proportion of Cypriots and poverty level in the United States with a correlation coefficient (R) of -0.323 and weighted average of 10.8%. Similarly, the statistical analysis conducted on geographies consisting of 92,094,185 people shows a substantial positive correlation between the proportion of Immigrants from Congo and poverty level in the United States with a correlation coefficient (R) of 0.523 and weighted average of 16.1%, a difference of 49.0%.
Poverty Correlation Summary
| Measurement | Cypriot | Immigrants from Congo |
| Minimum | 1.4% | 6.3% |
| Maximum | 24.8% | 41.0% |
| Range | 23.5% | 34.7% |
| Mean | 8.7% | 18.1% |
| Median | 7.7% | 16.1% |
| Interquartile 25% (IQ1) | 4.9% | 13.3% |
| Interquartile 75% (IQ3) | 11.4% | 20.0% |
| Interquartile Range (IQR) | 6.5% | 6.7% |
| Standard Deviation (Sample) | 4.9% | 7.4% |
| Standard Deviation (Population) | 4.9% | 7.4% |
Similar Demographics by Poverty
Demographics Similar to Cypriots by Poverty
In terms of poverty, the demographic groups most similar to Cypriots are Tongan (10.8%, a difference of 0.080%), Immigrants from Greece (10.8%, a difference of 0.10%), Immigrants from Poland (10.8%, a difference of 0.12%), Czech (10.8%, a difference of 0.14%), and Macedonian (10.8%, a difference of 0.21%).
| Demographics | Rating | Rank | Poverty |
| Greeks | 99.5 /100 | #29 | Exceptional 10.7% |
| Danes | 99.5 /100 | #30 | Exceptional 10.7% |
| Poles | 99.5 /100 | #31 | Exceptional 10.7% |
| Iranians | 99.5 /100 | #32 | Exceptional 10.7% |
| Macedonians | 99.4 /100 | #33 | Exceptional 10.8% |
| Immigrants | Poland | 99.4 /100 | #34 | Exceptional 10.8% |
| Tongans | 99.4 /100 | #35 | Exceptional 10.8% |
| Cypriots | 99.3 /100 | #36 | Exceptional 10.8% |
| Immigrants | Greece | 99.3 /100 | #37 | Exceptional 10.8% |
| Czechs | 99.3 /100 | #38 | Exceptional 10.8% |
| Immigrants | Pakistan | 99.3 /100 | #39 | Exceptional 10.8% |
| Russians | 99.3 /100 | #40 | Exceptional 10.9% |
| Immigrants | Iran | 99.2 /100 | #41 | Exceptional 10.9% |
| Koreans | 99.2 /100 | #42 | Exceptional 10.9% |
| Immigrants | Singapore | 99.2 /100 | #43 | Exceptional 10.9% |
Demographics Similar to Immigrants from Congo by Poverty
In terms of poverty, the demographic groups most similar to Immigrants from Congo are Immigrants from Dominica (16.1%, a difference of 0.20%), Immigrants from Honduras (16.2%, a difference of 0.23%), U.S. Virgin Islander (16.1%, a difference of 0.49%), Arapaho (16.3%, a difference of 0.97%), and Honduran (15.9%, a difference of 1.7%).
| Demographics | Rating | Rank | Poverty |
| Cajuns | 0.0 /100 | #312 | Tragic 15.7% |
| Immigrants | Grenada | 0.0 /100 | #313 | Tragic 15.8% |
| Immigrants | Somalia | 0.0 /100 | #314 | Tragic 15.8% |
| British West Indians | 0.0 /100 | #315 | Tragic 15.9% |
| Hondurans | 0.0 /100 | #316 | Tragic 15.9% |
| U.S. Virgin Islanders | 0.0 /100 | #317 | Tragic 16.1% |
| Immigrants | Dominica | 0.0 /100 | #318 | Tragic 16.1% |
| Immigrants | Congo | 0.0 /100 | #319 | Tragic 16.1% |
| Immigrants | Honduras | 0.0 /100 | #320 | Tragic 16.2% |
| Arapaho | 0.0 /100 | #321 | Tragic 16.3% |
| Menominee | 0.0 /100 | #322 | Tragic 16.4% |
| Colville | 0.0 /100 | #323 | Tragic 16.6% |
| Yakama | 0.0 /100 | #324 | Tragic 16.7% |
| Central American Indians | 0.0 /100 | #325 | Tragic 16.7% |
| Paiute | 0.0 /100 | #326 | Tragic 16.7% |