Cypriot vs Immigrants from Europe Unemployment Among Ages 30 to 34 years
COMPARE
Cypriot
Immigrants from Europe
Unemployment Among Ages 30 to 34 years
Unemployment Among Ages 30 to 34 years Comparison
Cypriots
Immigrants from Europe
5.1%
UNEMPLOYMENT AMONG AGES 30 TO 34 YEARS
98.4/ 100
METRIC RATING
47th/ 347
METRIC RANK
5.4%
UNEMPLOYMENT AMONG AGES 30 TO 34 YEARS
72.1/ 100
METRIC RATING
141st/ 347
METRIC RANK
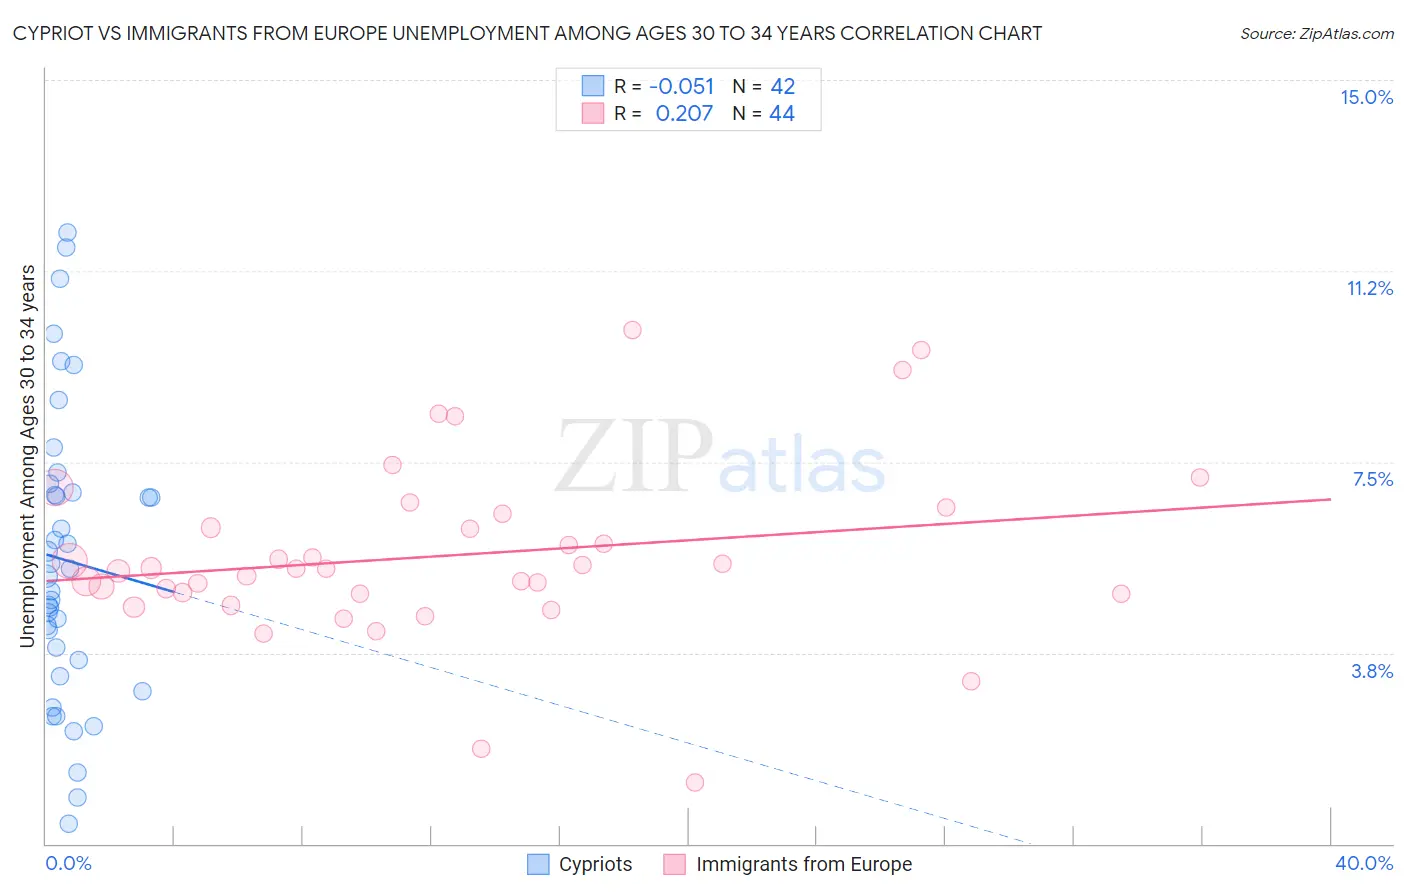
Cypriot vs Immigrants from Europe Unemployment Among Ages 30 to 34 years Correlation Chart
The statistical analysis conducted on geographies consisting of 61,053,204 people shows a slight negative correlation between the proportion of Cypriots and unemployment rate among population between the ages 30 and 34 in the United States with a correlation coefficient (R) of -0.051 and weighted average of 5.1%. Similarly, the statistical analysis conducted on geographies consisting of 487,978,612 people shows a weak positive correlation between the proportion of Immigrants from Europe and unemployment rate among population between the ages 30 and 34 in the United States with a correlation coefficient (R) of 0.207 and weighted average of 5.4%, a difference of 5.9%.
Unemployment Among Ages 30 to 34 years Correlation Summary
| Measurement | Cypriot | Immigrants from Europe |
| Minimum | 0.40% | 1.2% |
| Maximum | 12.0% | 10.1% |
| Range | 11.6% | 8.9% |
| Mean | 5.6% | 5.7% |
| Median | 5.3% | 5.4% |
| Interquartile 25% (IQ1) | 3.6% | 4.9% |
| Interquartile 75% (IQ3) | 6.9% | 6.3% |
| Interquartile Range (IQR) | 3.3% | 1.4% |
| Standard Deviation (Sample) | 2.8% | 1.7% |
| Standard Deviation (Population) | 2.8% | 1.7% |
Similar Demographics by Unemployment Among Ages 30 to 34 years
Demographics Similar to Cypriots by Unemployment Among Ages 30 to 34 years
In terms of unemployment among ages 30 to 34 years, the demographic groups most similar to Cypriots are Assyrian/Chaldean/Syriac (5.1%, a difference of 0.020%), Immigrants from Congo (5.1%, a difference of 0.030%), Immigrants from Malaysia (5.1%, a difference of 0.14%), Puget Sound Salish (5.1%, a difference of 0.21%), and Turkish (5.1%, a difference of 0.25%).
| Demographics | Rating | Rank | Unemployment Among Ages 30 to 34 years |
| Immigrants | Vietnam | 98.9 /100 | #40 | Exceptional 5.0% |
| Immigrants | Eastern Africa | 98.9 /100 | #41 | Exceptional 5.0% |
| Immigrants | Hong Kong | 98.8 /100 | #42 | Exceptional 5.0% |
| Soviet Union | 98.8 /100 | #43 | Exceptional 5.0% |
| Immigrants | Belgium | 98.7 /100 | #44 | Exceptional 5.1% |
| Yugoslavians | 98.6 /100 | #45 | Exceptional 5.1% |
| Immigrants | Congo | 98.4 /100 | #46 | Exceptional 5.1% |
| Cypriots | 98.4 /100 | #47 | Exceptional 5.1% |
| Assyrians/Chaldeans/Syriacs | 98.4 /100 | #48 | Exceptional 5.1% |
| Immigrants | Malaysia | 98.3 /100 | #49 | Exceptional 5.1% |
| Puget Sound Salish | 98.2 /100 | #50 | Exceptional 5.1% |
| Turks | 98.2 /100 | #51 | Exceptional 5.1% |
| Immigrants | Burma/Myanmar | 98.1 /100 | #52 | Exceptional 5.1% |
| Cubans | 98.1 /100 | #53 | Exceptional 5.1% |
| Immigrants | Morocco | 97.9 /100 | #54 | Exceptional 5.1% |
Demographics Similar to Immigrants from Europe by Unemployment Among Ages 30 to 34 years
In terms of unemployment among ages 30 to 34 years, the demographic groups most similar to Immigrants from Europe are Immigrants from Greece (5.4%, a difference of 0.0%), Immigrants from North America (5.4%, a difference of 0.020%), Lithuanian (5.4%, a difference of 0.030%), Serbian (5.4%, a difference of 0.080%), and Russian (5.4%, a difference of 0.080%).
| Demographics | Rating | Rank | Unemployment Among Ages 30 to 34 years |
| Bangladeshis | 76.6 /100 | #134 | Good 5.3% |
| Palestinians | 75.1 /100 | #135 | Good 5.4% |
| Pakistanis | 74.6 /100 | #136 | Good 5.4% |
| Immigrants | Canada | 74.6 /100 | #137 | Good 5.4% |
| Serbians | 72.9 /100 | #138 | Good 5.4% |
| Lithuanians | 72.4 /100 | #139 | Good 5.4% |
| Immigrants | North America | 72.2 /100 | #140 | Good 5.4% |
| Immigrants | Europe | 72.1 /100 | #141 | Good 5.4% |
| Immigrants | Greece | 72.0 /100 | #142 | Good 5.4% |
| Russians | 71.1 /100 | #143 | Good 5.4% |
| Immigrants | Russia | 71.0 /100 | #144 | Good 5.4% |
| Syrians | 70.3 /100 | #145 | Good 5.4% |
| Celtics | 70.2 /100 | #146 | Good 5.4% |
| Ukrainians | 69.2 /100 | #147 | Good 5.4% |
| Immigrants | Iran | 69.1 /100 | #148 | Good 5.4% |