Cuban vs Cheyenne 12th Grade, No Diploma
COMPARE
Cuban
Cheyenne
12th Grade, No Diploma
12th Grade, No Diploma Comparison
Cubans
Cheyenne
88.9%
12TH GRADE, NO DIPLOMA
0.0/ 100
METRIC RATING
281st/ 347
METRIC RANK
89.6%
12TH GRADE, NO DIPLOMA
0.4/ 100
METRIC RATING
261st/ 347
METRIC RANK
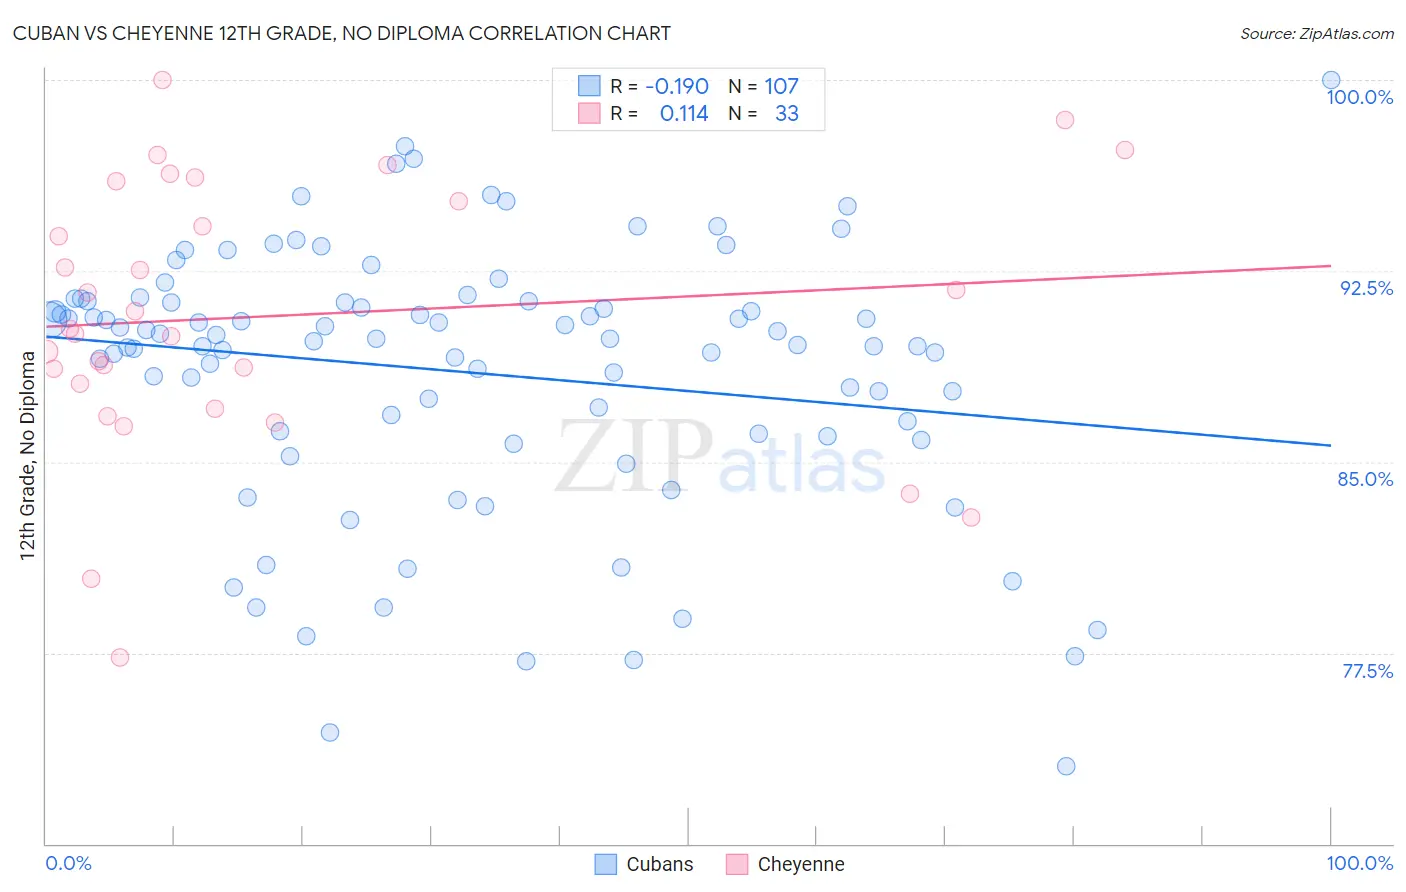
Cuban vs Cheyenne 12th Grade, No Diploma Correlation Chart
The statistical analysis conducted on geographies consisting of 449,351,555 people shows a poor negative correlation between the proportion of Cubans and percentage of population with at least 12th grade (no diploma) education in the United States with a correlation coefficient (R) of -0.190 and weighted average of 88.9%. Similarly, the statistical analysis conducted on geographies consisting of 80,719,287 people shows a poor positive correlation between the proportion of Cheyenne and percentage of population with at least 12th grade (no diploma) education in the United States with a correlation coefficient (R) of 0.114 and weighted average of 89.6%, a difference of 0.82%.
12th Grade, No Diploma Correlation Summary
| Measurement | Cuban | Cheyenne |
| Minimum | 73.0% | 77.3% |
| Maximum | 100.0% | 100.0% |
| Range | 27.0% | 22.7% |
| Mean | 88.5% | 90.7% |
| Median | 89.8% | 90.2% |
| Interquartile 25% (IQ1) | 86.1% | 87.6% |
| Interquartile 75% (IQ3) | 91.3% | 95.6% |
| Interquartile Range (IQR) | 5.2% | 8.0% |
| Standard Deviation (Sample) | 5.2% | 5.3% |
| Standard Deviation (Population) | 5.2% | 5.2% |
Demographics Similar to Cubans and Cheyenne by 12th Grade, No Diploma
In terms of 12th grade, no diploma, the demographic groups most similar to Cubans are Immigrants from Laos (88.9%, a difference of 0.010%), Immigrants from Burma/Myanmar (88.9%, a difference of 0.010%), Immigrants from St. Vincent and the Grenadines (88.9%, a difference of 0.080%), Immigrants from Barbados (89.0%, a difference of 0.15%), and Immigrants from Congo (89.0%, a difference of 0.20%). Similarly, the demographic groups most similar to Cheyenne are Sioux (89.6%, a difference of 0.0%), Immigrants from Jamaica (89.5%, a difference of 0.14%), Sri Lankan (89.4%, a difference of 0.19%), Trinidadian and Tobagonian (89.4%, a difference of 0.20%), and Seminole (89.4%, a difference of 0.28%).
| Demographics | Rating | Rank | 12th Grade, No Diploma |
| Cheyenne | 0.4 /100 | #261 | Tragic 89.6% |
| Sioux | 0.4 /100 | #262 | Tragic 89.6% |
| Immigrants | Jamaica | 0.2 /100 | #263 | Tragic 89.5% |
| Sri Lankans | 0.2 /100 | #264 | Tragic 89.4% |
| Trinidadians and Tobagonians | 0.2 /100 | #265 | Tragic 89.4% |
| Seminole | 0.2 /100 | #266 | Tragic 89.4% |
| West Indians | 0.2 /100 | #267 | Tragic 89.3% |
| Immigrants | Trinidad and Tobago | 0.1 /100 | #268 | Tragic 89.3% |
| U.S. Virgin Islanders | 0.1 /100 | #269 | Tragic 89.3% |
| Bangladeshis | 0.1 /100 | #270 | Tragic 89.3% |
| Blacks/African Americans | 0.1 /100 | #271 | Tragic 89.3% |
| Malaysians | 0.1 /100 | #272 | Tragic 89.2% |
| Barbadians | 0.1 /100 | #273 | Tragic 89.1% |
| Cajuns | 0.1 /100 | #274 | Tragic 89.1% |
| Immigrants | Congo | 0.1 /100 | #275 | Tragic 89.0% |
| Ute | 0.1 /100 | #276 | Tragic 89.0% |
| Immigrants | Barbados | 0.0 /100 | #277 | Tragic 89.0% |
| Immigrants | St. Vincent and the Grenadines | 0.0 /100 | #278 | Tragic 88.9% |
| Immigrants | Laos | 0.0 /100 | #279 | Tragic 88.9% |
| Immigrants | Burma/Myanmar | 0.0 /100 | #280 | Tragic 88.9% |
| Cubans | 0.0 /100 | #281 | Tragic 88.9% |