Immigrants from Africa vs Cheyenne Receiving Food Stamps
COMPARE
Immigrants from Africa
Cheyenne
Receiving Food Stamps
Receiving Food Stamps Comparison
Immigrants from Africa
Cheyenne
12.8%
RECEIVING FOOD STAMPS
7.6/ 100
METRIC RATING
214th/ 347
METRIC RANK
14.3%
RECEIVING FOOD STAMPS
0.2/ 100
METRIC RATING
266th/ 347
METRIC RANK
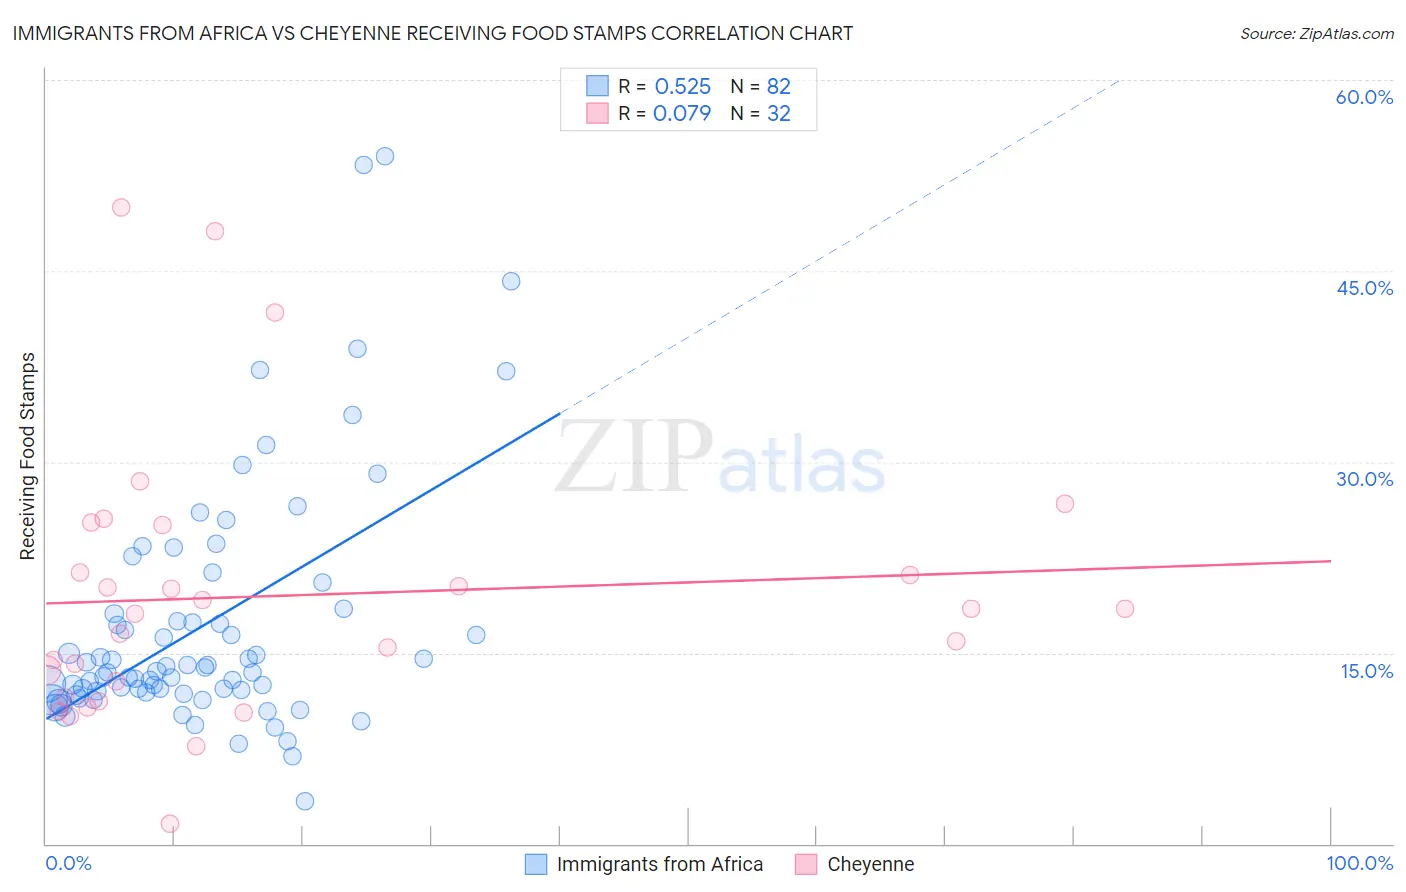
Immigrants from Africa vs Cheyenne Receiving Food Stamps Correlation Chart
The statistical analysis conducted on geographies consisting of 467,597,829 people shows a substantial positive correlation between the proportion of Immigrants from Africa and percentage of population receiving government assistance and/or food stamps in the United States with a correlation coefficient (R) of 0.525 and weighted average of 12.8%. Similarly, the statistical analysis conducted on geographies consisting of 80,695,470 people shows a slight positive correlation between the proportion of Cheyenne and percentage of population receiving government assistance and/or food stamps in the United States with a correlation coefficient (R) of 0.079 and weighted average of 14.3%, a difference of 12.0%.
Receiving Food Stamps Correlation Summary
| Measurement | Immigrants from Africa | Cheyenne |
| Minimum | 3.3% | 1.6% |
| Maximum | 54.0% | 50.0% |
| Range | 50.7% | 48.4% |
| Mean | 17.1% | 19.5% |
| Median | 13.5% | 18.3% |
| Interquartile 25% (IQ1) | 11.9% | 12.1% |
| Interquartile 75% (IQ3) | 18.1% | 23.2% |
| Interquartile Range (IQR) | 6.2% | 11.0% |
| Standard Deviation (Sample) | 9.7% | 10.8% |
| Standard Deviation (Population) | 9.6% | 10.6% |
Similar Demographics by Receiving Food Stamps
Demographics Similar to Immigrants from Africa by Receiving Food Stamps
In terms of receiving food stamps, the demographic groups most similar to Immigrants from Africa are Moroccan (12.8%, a difference of 0.030%), Malaysian (12.7%, a difference of 0.43%), Native Hawaiian (12.8%, a difference of 0.44%), Immigrants from South America (12.8%, a difference of 0.55%), and Immigrants from Burma/Myanmar (12.9%, a difference of 0.81%).
| Demographics | Rating | Rank | Receiving Food Stamps |
| South Americans | 16.0 /100 | #207 | Poor 12.4% |
| Potawatomi | 14.6 /100 | #208 | Poor 12.5% |
| Immigrants | Sierra Leone | 12.9 /100 | #209 | Poor 12.5% |
| Immigrants | Uruguay | 12.8 /100 | #210 | Poor 12.5% |
| Colombians | 10.2 /100 | #211 | Poor 12.6% |
| Malaysians | 8.5 /100 | #212 | Tragic 12.7% |
| Moroccans | 7.6 /100 | #213 | Tragic 12.8% |
| Immigrants | Africa | 7.6 /100 | #214 | Tragic 12.8% |
| Native Hawaiians | 6.7 /100 | #215 | Tragic 12.8% |
| Immigrants | South America | 6.5 /100 | #216 | Tragic 12.8% |
| Immigrants | Burma/Myanmar | 6.0 /100 | #217 | Tragic 12.9% |
| Hawaiians | 5.4 /100 | #218 | Tragic 12.9% |
| Immigrants | Middle Africa | 5.4 /100 | #219 | Tragic 12.9% |
| Immigrants | Colombia | 5.3 /100 | #220 | Tragic 12.9% |
| Bermudans | 4.8 /100 | #221 | Tragic 13.0% |
Demographics Similar to Cheyenne by Receiving Food Stamps
In terms of receiving food stamps, the demographic groups most similar to Cheyenne are Blackfeet (14.3%, a difference of 0.080%), Immigrants from Uzbekistan (14.3%, a difference of 0.14%), Dutch West Indian (14.3%, a difference of 0.22%), Paiute (14.3%, a difference of 0.23%), and Immigrants from Portugal (14.3%, a difference of 0.23%).
| Demographics | Rating | Rank | Receiving Food Stamps |
| Creek | 0.3 /100 | #259 | Tragic 14.1% |
| Central Americans | 0.3 /100 | #260 | Tragic 14.1% |
| Immigrants | Congo | 0.3 /100 | #261 | Tragic 14.1% |
| Paiute | 0.2 /100 | #262 | Tragic 14.3% |
| Immigrants | Portugal | 0.2 /100 | #263 | Tragic 14.3% |
| Immigrants | Uzbekistan | 0.2 /100 | #264 | Tragic 14.3% |
| Blackfeet | 0.2 /100 | #265 | Tragic 14.3% |
| Cheyenne | 0.2 /100 | #266 | Tragic 14.3% |
| Dutch West Indians | 0.2 /100 | #267 | Tragic 14.3% |
| Guatemalans | 0.1 /100 | #268 | Tragic 14.4% |
| Nepalese | 0.1 /100 | #269 | Tragic 14.6% |
| Mexicans | 0.1 /100 | #270 | Tragic 14.6% |
| Immigrants | Guatemala | 0.1 /100 | #271 | Tragic 14.6% |
| Chippewa | 0.1 /100 | #272 | Tragic 14.7% |
| Alaskan Athabascans | 0.1 /100 | #273 | Tragic 14.7% |