Crow vs Sudanese Female Poverty Among 18-24 Year Olds
COMPARE
Crow
Sudanese
Female Poverty Among 18-24 Year Olds
Female Poverty Among 18-24 Year Olds Comparison
Crow
Sudanese
33.2%
FEMALE POVERTY AMONG 18-24 YEAR OLDS
0.0/ 100
METRIC RATING
347th/ 347
METRIC RANK
23.0%
FEMALE POVERTY AMONG 18-24 YEAR OLDS
0.0/ 100
METRIC RATING
304th/ 347
METRIC RANK
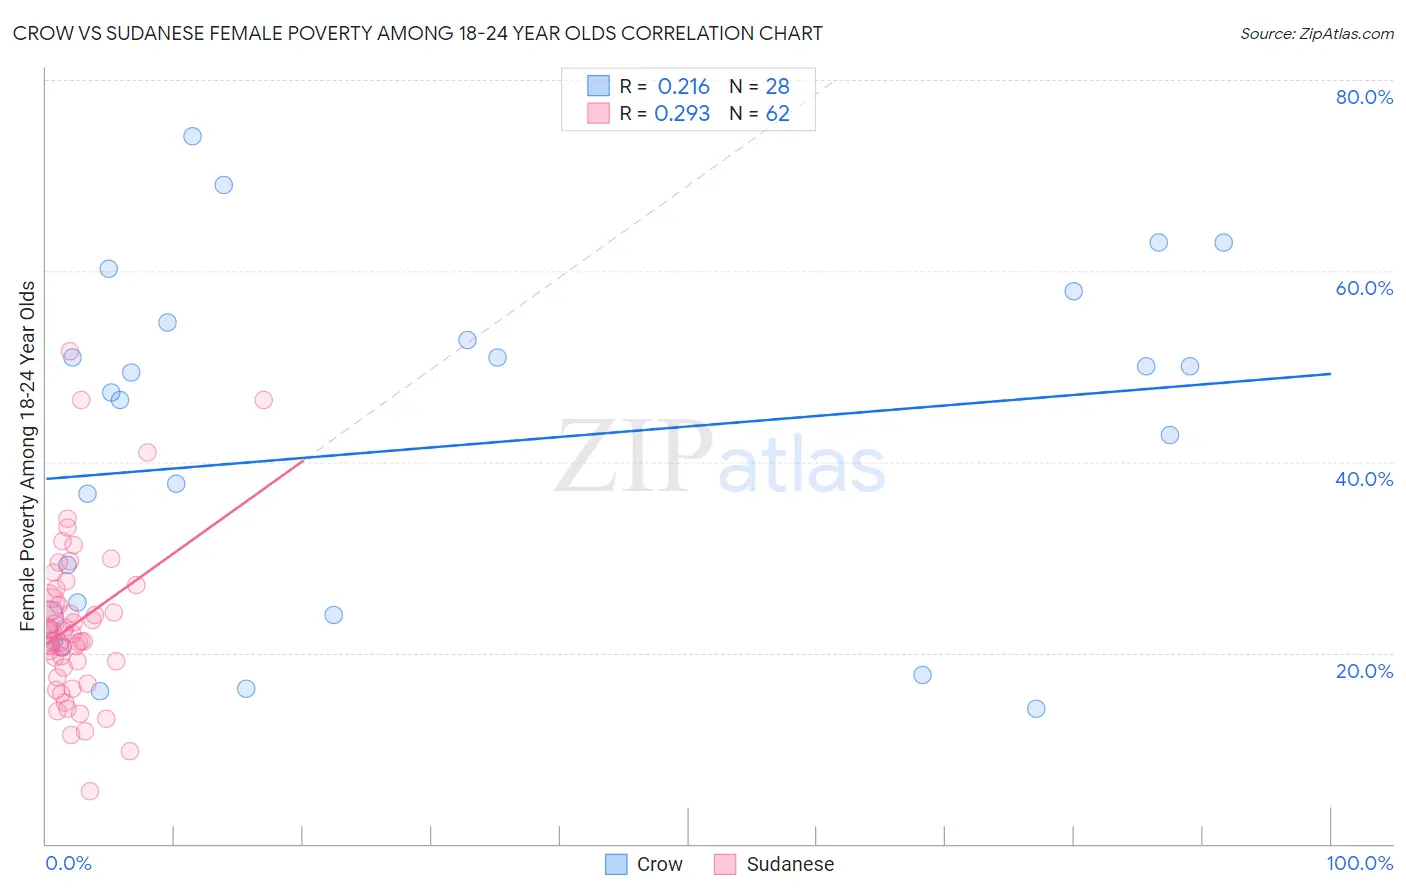
Crow vs Sudanese Female Poverty Among 18-24 Year Olds Correlation Chart
The statistical analysis conducted on geographies consisting of 58,788,428 people shows a weak positive correlation between the proportion of Crow and poverty level among females between the ages 18 and 24 in the United States with a correlation coefficient (R) of 0.216 and weighted average of 33.2%. Similarly, the statistical analysis conducted on geographies consisting of 109,658,640 people shows a weak positive correlation between the proportion of Sudanese and poverty level among females between the ages 18 and 24 in the United States with a correlation coefficient (R) of 0.293 and weighted average of 23.0%, a difference of 44.3%.
Female Poverty Among 18-24 Year Olds Correlation Summary
| Measurement | Crow | Sudanese |
| Minimum | 14.1% | 5.6% |
| Maximum | 74.1% | 51.6% |
| Range | 60.0% | 46.0% |
| Mean | 41.6% | 23.0% |
| Median | 46.8% | 22.1% |
| Interquartile 25% (IQ1) | 23.8% | 19.1% |
| Interquartile 75% (IQ3) | 53.6% | 25.7% |
| Interquartile Range (IQR) | 29.8% | 6.7% |
| Standard Deviation (Sample) | 17.9% | 8.4% |
| Standard Deviation (Population) | 17.6% | 8.4% |
Similar Demographics by Female Poverty Among 18-24 Year Olds
Demographics Similar to Crow by Female Poverty Among 18-24 Year Olds
In terms of female poverty among 18-24 year olds, the demographic groups most similar to Crow are Lumbee (31.1%, a difference of 7.0%), Tohono O'odham (31.0%, a difference of 7.1%), Navajo (30.3%, a difference of 9.6%), Puerto Rican (29.8%, a difference of 11.3%), and Kiowa (29.2%, a difference of 13.6%).
| Demographics | Rating | Rank | Female Poverty Among 18-24 Year Olds |
| Apache | 0.0 /100 | #333 | Tragic 26.3% |
| Pueblo | 0.0 /100 | #334 | Tragic 26.9% |
| Yup'ik | 0.0 /100 | #335 | Tragic 27.0% |
| Immigrants | Yemen | 0.0 /100 | #336 | Tragic 27.5% |
| Cheyenne | 0.0 /100 | #337 | Tragic 28.1% |
| Hopi | 0.0 /100 | #338 | Tragic 28.2% |
| Pima | 0.0 /100 | #339 | Tragic 28.4% |
| Sioux | 0.0 /100 | #340 | Tragic 28.6% |
| Colville | 0.0 /100 | #341 | Tragic 29.0% |
| Kiowa | 0.0 /100 | #342 | Tragic 29.2% |
| Puerto Ricans | 0.0 /100 | #343 | Tragic 29.8% |
| Navajo | 0.0 /100 | #344 | Tragic 30.3% |
| Tohono O'odham | 0.0 /100 | #345 | Tragic 31.0% |
| Lumbee | 0.0 /100 | #346 | Tragic 31.1% |
| Crow | 0.0 /100 | #347 | Tragic 33.2% |
Demographics Similar to Sudanese by Female Poverty Among 18-24 Year Olds
In terms of female poverty among 18-24 year olds, the demographic groups most similar to Sudanese are Immigrants from Kuwait (23.0%, a difference of 0.050%), Senegalese (23.0%, a difference of 0.14%), Iroquois (22.9%, a difference of 0.30%), Seminole (22.9%, a difference of 0.69%), and African (22.8%, a difference of 0.77%).
| Demographics | Rating | Rank | Female Poverty Among 18-24 Year Olds |
| Inupiat | 0.0 /100 | #297 | Tragic 22.6% |
| Central American Indians | 0.0 /100 | #298 | Tragic 22.6% |
| Cherokee | 0.0 /100 | #299 | Tragic 22.7% |
| Africans | 0.0 /100 | #300 | Tragic 22.8% |
| Seminole | 0.0 /100 | #301 | Tragic 22.9% |
| Iroquois | 0.0 /100 | #302 | Tragic 22.9% |
| Senegalese | 0.0 /100 | #303 | Tragic 23.0% |
| Sudanese | 0.0 /100 | #304 | Tragic 23.0% |
| Immigrants | Kuwait | 0.0 /100 | #305 | Tragic 23.0% |
| Paiute | 0.0 /100 | #306 | Tragic 23.3% |
| Cree | 0.0 /100 | #307 | Tragic 23.4% |
| Immigrants | Sudan | 0.0 /100 | #308 | Tragic 23.5% |
| Blackfeet | 0.0 /100 | #309 | Tragic 23.6% |
| Comanche | 0.0 /100 | #310 | Tragic 23.6% |
| Potawatomi | 0.0 /100 | #311 | Tragic 23.7% |