Crow vs Sudanese 9th Grade
COMPARE
Crow
Sudanese
9th Grade
9th Grade Comparison
Crow
Sudanese
96.1%
9TH GRADE
99.9/ 100
METRIC RATING
45th/ 347
METRIC RANK
94.7%
9TH GRADE
32.7/ 100
METRIC RATING
190th/ 347
METRIC RANK
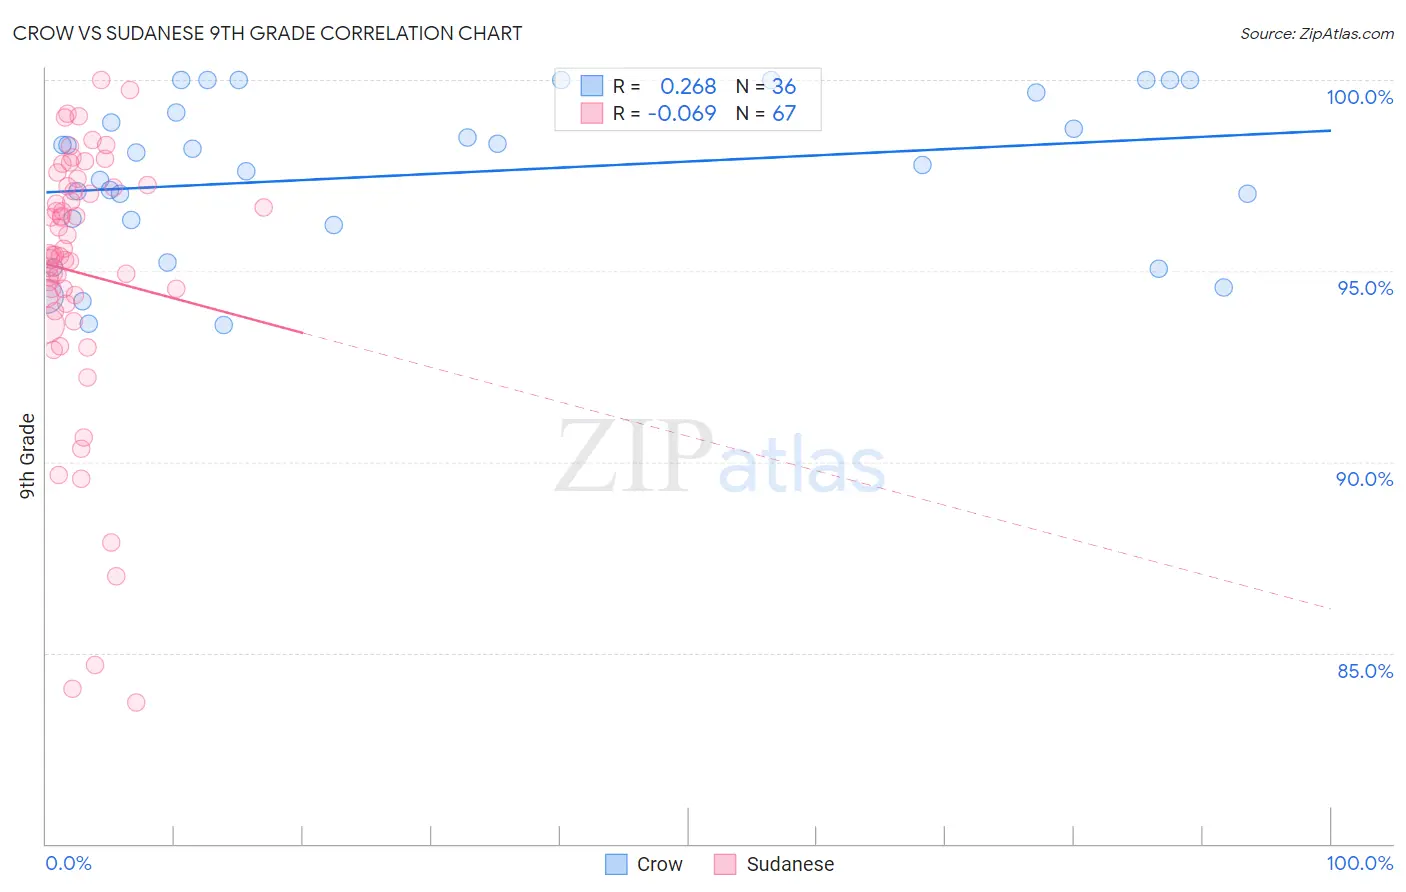
Crow vs Sudanese 9th Grade Correlation Chart
The statistical analysis conducted on geographies consisting of 59,209,980 people shows a weak positive correlation between the proportion of Crow and percentage of population with at least 9th grade education in the United States with a correlation coefficient (R) of 0.268 and weighted average of 96.1%. Similarly, the statistical analysis conducted on geographies consisting of 110,134,719 people shows a slight negative correlation between the proportion of Sudanese and percentage of population with at least 9th grade education in the United States with a correlation coefficient (R) of -0.069 and weighted average of 94.7%, a difference of 1.4%.
9th Grade Correlation Summary
| Measurement | Crow | Sudanese |
| Minimum | 93.6% | 83.7% |
| Maximum | 100.0% | 100.0% |
| Range | 6.4% | 16.3% |
| Mean | 97.5% | 95.0% |
| Median | 97.9% | 95.4% |
| Interquartile 25% (IQ1) | 96.3% | 94.1% |
| Interquartile 75% (IQ3) | 99.4% | 97.2% |
| Interquartile Range (IQR) | 3.2% | 3.1% |
| Standard Deviation (Sample) | 2.0% | 3.5% |
| Standard Deviation (Population) | 2.0% | 3.5% |
Similar Demographics by 9th Grade
Demographics Similar to Crow by 9th Grade
In terms of 9th grade, the demographic groups most similar to Crow are Immigrants from India (96.1%, a difference of 0.0%), Alaska Native (96.1%, a difference of 0.010%), Russian (96.0%, a difference of 0.010%), Australian (96.0%, a difference of 0.010%), and Greek (96.0%, a difference of 0.020%).
| Demographics | Rating | Rank | 9th Grade |
| Immigrants | Scotland | 99.9 /100 | #38 | Exceptional 96.1% |
| Ottawa | 99.9 /100 | #39 | Exceptional 96.1% |
| Slavs | 99.9 /100 | #40 | Exceptional 96.1% |
| Czechoslovakians | 99.9 /100 | #41 | Exceptional 96.1% |
| Chippewa | 99.9 /100 | #42 | Exceptional 96.1% |
| Iranians | 99.9 /100 | #43 | Exceptional 96.1% |
| Alaska Natives | 99.9 /100 | #44 | Exceptional 96.1% |
| Crow | 99.9 /100 | #45 | Exceptional 96.1% |
| Immigrants | India | 99.9 /100 | #46 | Exceptional 96.1% |
| Russians | 99.9 /100 | #47 | Exceptional 96.0% |
| Australians | 99.9 /100 | #48 | Exceptional 96.0% |
| Greeks | 99.9 /100 | #49 | Exceptional 96.0% |
| Celtics | 99.9 /100 | #50 | Exceptional 96.0% |
| Immigrants | Northern Europe | 99.9 /100 | #51 | Exceptional 96.0% |
| Serbians | 99.9 /100 | #52 | Exceptional 96.0% |
Demographics Similar to Sudanese by 9th Grade
In terms of 9th grade, the demographic groups most similar to Sudanese are Immigrants from Argentina (94.8%, a difference of 0.010%), Assyrian/Chaldean/Syriac (94.7%, a difference of 0.010%), Guamanian/Chamorro (94.8%, a difference of 0.020%), Immigrants from Albania (94.8%, a difference of 0.020%), and Immigrants from Northern Africa (94.7%, a difference of 0.020%).
| Demographics | Rating | Rank | 9th Grade |
| Immigrants | Nepal | 39.7 /100 | #183 | Fair 94.8% |
| Argentineans | 37.6 /100 | #184 | Fair 94.8% |
| Liberians | 37.4 /100 | #185 | Fair 94.8% |
| Hopi | 37.1 /100 | #186 | Fair 94.8% |
| Guamanians/Chamorros | 35.5 /100 | #187 | Fair 94.8% |
| Immigrants | Albania | 34.5 /100 | #188 | Fair 94.8% |
| Immigrants | Argentina | 34.4 /100 | #189 | Fair 94.8% |
| Sudanese | 32.7 /100 | #190 | Fair 94.7% |
| Assyrians/Chaldeans/Syriacs | 32.0 /100 | #191 | Fair 94.7% |
| Immigrants | Northern Africa | 30.7 /100 | #192 | Fair 94.7% |
| Paraguayans | 30.1 /100 | #193 | Fair 94.7% |
| Panamanians | 29.0 /100 | #194 | Fair 94.7% |
| Marshallese | 27.9 /100 | #195 | Fair 94.7% |
| Immigrants | Lebanon | 27.2 /100 | #196 | Fair 94.7% |
| Immigrants | Micronesia | 24.7 /100 | #197 | Fair 94.7% |