Immigrants from Africa vs Sudanese Female Poverty Among 18-24 Year Olds
COMPARE
Immigrants from Africa
Sudanese
Female Poverty Among 18-24 Year Olds
Female Poverty Among 18-24 Year Olds Comparison
Immigrants from Africa
Sudanese
21.0%
FEMALE POVERTY AMONG 18-24 YEAR OLDS
3.0/ 100
METRIC RATING
247th/ 347
METRIC RANK
23.0%
FEMALE POVERTY AMONG 18-24 YEAR OLDS
0.0/ 100
METRIC RATING
304th/ 347
METRIC RANK
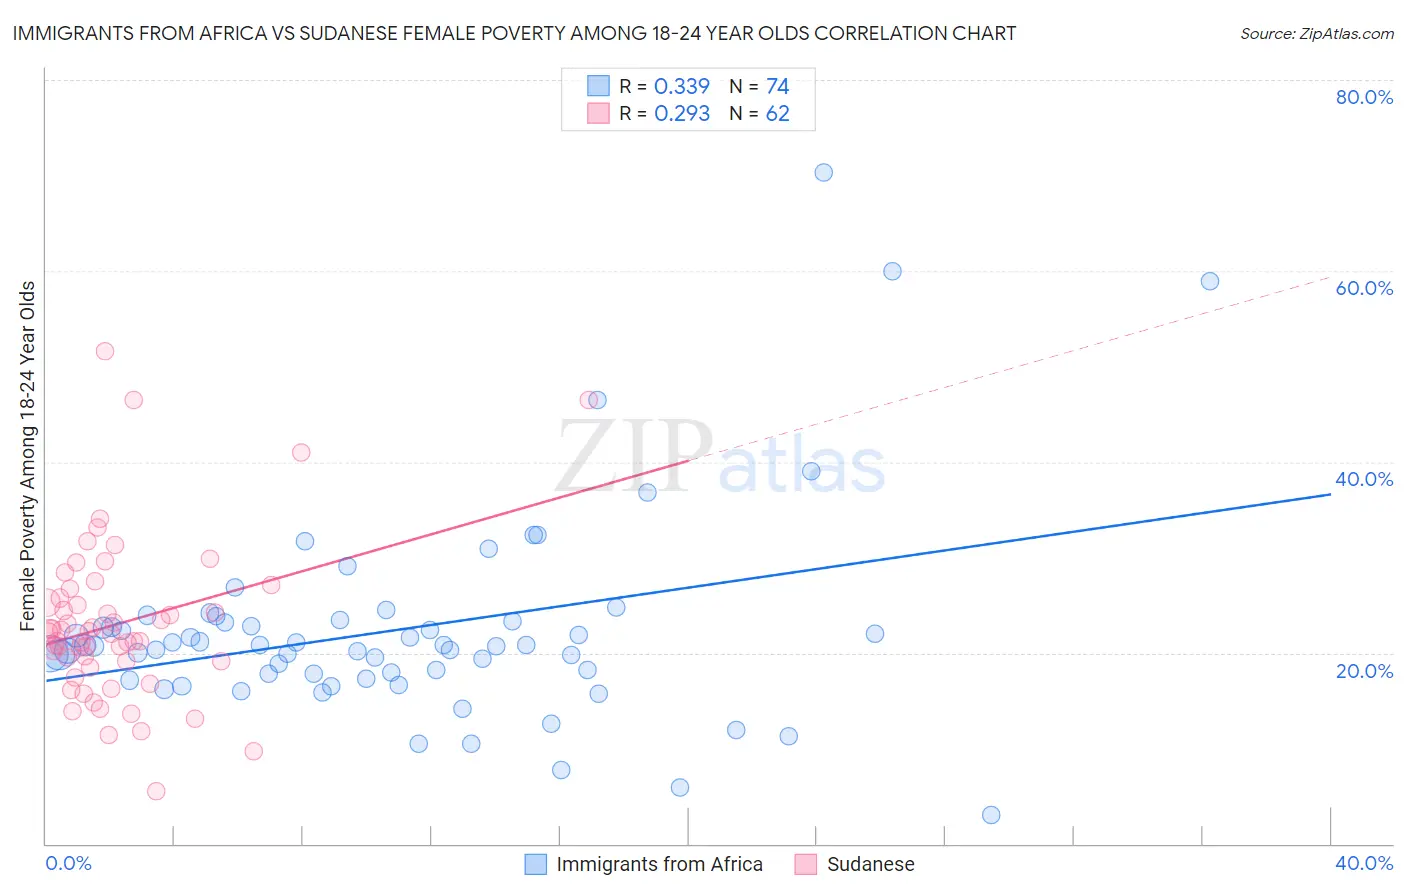
Immigrants from Africa vs Sudanese Female Poverty Among 18-24 Year Olds Correlation Chart
The statistical analysis conducted on geographies consisting of 455,098,346 people shows a mild positive correlation between the proportion of Immigrants from Africa and poverty level among females between the ages 18 and 24 in the United States with a correlation coefficient (R) of 0.339 and weighted average of 21.0%. Similarly, the statistical analysis conducted on geographies consisting of 109,658,640 people shows a weak positive correlation between the proportion of Sudanese and poverty level among females between the ages 18 and 24 in the United States with a correlation coefficient (R) of 0.293 and weighted average of 23.0%, a difference of 9.8%.
Female Poverty Among 18-24 Year Olds Correlation Summary
| Measurement | Immigrants from Africa | Sudanese |
| Minimum | 3.0% | 5.6% |
| Maximum | 70.3% | 51.6% |
| Range | 67.3% | 46.0% |
| Mean | 22.4% | 23.0% |
| Median | 20.8% | 22.1% |
| Interquartile 25% (IQ1) | 17.8% | 19.1% |
| Interquartile 75% (IQ3) | 23.3% | 25.7% |
| Interquartile Range (IQR) | 5.5% | 6.7% |
| Standard Deviation (Sample) | 10.9% | 8.4% |
| Standard Deviation (Population) | 10.8% | 8.4% |
Similar Demographics by Female Poverty Among 18-24 Year Olds
Demographics Similar to Immigrants from Africa by Female Poverty Among 18-24 Year Olds
In terms of female poverty among 18-24 year olds, the demographic groups most similar to Immigrants from Africa are Immigrants from Australia (20.9%, a difference of 0.060%), Aleut (20.9%, a difference of 0.14%), Immigrants from Thailand (20.9%, a difference of 0.17%), Marshallese (20.9%, a difference of 0.18%), and Immigrants from Kenya (21.0%, a difference of 0.20%).
| Demographics | Rating | Rank | Female Poverty Among 18-24 Year Olds |
| Luxembourgers | 4.2 /100 | #240 | Tragic 20.9% |
| Immigrants | Eritrea | 4.2 /100 | #241 | Tragic 20.9% |
| Israelis | 4.1 /100 | #242 | Tragic 20.9% |
| Marshallese | 3.4 /100 | #243 | Tragic 20.9% |
| Immigrants | Thailand | 3.4 /100 | #244 | Tragic 20.9% |
| Aleuts | 3.3 /100 | #245 | Tragic 20.9% |
| Immigrants | Australia | 3.1 /100 | #246 | Tragic 20.9% |
| Immigrants | Africa | 3.0 /100 | #247 | Tragic 21.0% |
| Immigrants | Kenya | 2.5 /100 | #248 | Tragic 21.0% |
| Carpatho Rusyns | 2.5 /100 | #249 | Tragic 21.0% |
| Immigrants | West Indies | 2.2 /100 | #250 | Tragic 21.0% |
| West Indians | 1.9 /100 | #251 | Tragic 21.1% |
| South Africans | 1.6 /100 | #252 | Tragic 21.1% |
| Delaware | 1.6 /100 | #253 | Tragic 21.1% |
| British West Indians | 1.2 /100 | #254 | Tragic 21.2% |
Demographics Similar to Sudanese by Female Poverty Among 18-24 Year Olds
In terms of female poverty among 18-24 year olds, the demographic groups most similar to Sudanese are Immigrants from Kuwait (23.0%, a difference of 0.050%), Senegalese (23.0%, a difference of 0.14%), Iroquois (22.9%, a difference of 0.30%), Seminole (22.9%, a difference of 0.69%), and African (22.8%, a difference of 0.77%).
| Demographics | Rating | Rank | Female Poverty Among 18-24 Year Olds |
| Inupiat | 0.0 /100 | #297 | Tragic 22.6% |
| Central American Indians | 0.0 /100 | #298 | Tragic 22.6% |
| Cherokee | 0.0 /100 | #299 | Tragic 22.7% |
| Africans | 0.0 /100 | #300 | Tragic 22.8% |
| Seminole | 0.0 /100 | #301 | Tragic 22.9% |
| Iroquois | 0.0 /100 | #302 | Tragic 22.9% |
| Senegalese | 0.0 /100 | #303 | Tragic 23.0% |
| Sudanese | 0.0 /100 | #304 | Tragic 23.0% |
| Immigrants | Kuwait | 0.0 /100 | #305 | Tragic 23.0% |
| Paiute | 0.0 /100 | #306 | Tragic 23.3% |
| Cree | 0.0 /100 | #307 | Tragic 23.4% |
| Immigrants | Sudan | 0.0 /100 | #308 | Tragic 23.5% |
| Blackfeet | 0.0 /100 | #309 | Tragic 23.6% |
| Comanche | 0.0 /100 | #310 | Tragic 23.6% |
| Potawatomi | 0.0 /100 | #311 | Tragic 23.7% |