Immigrants from Latin America vs Sudanese Female Poverty Among 18-24 Year Olds
COMPARE
Immigrants from Latin America
Sudanese
Female Poverty Among 18-24 Year Olds
Female Poverty Among 18-24 Year Olds Comparison
Immigrants from Latin America
Sudanese
19.7%
FEMALE POVERTY AMONG 18-24 YEAR OLDS
81.3/ 100
METRIC RATING
148th/ 347
METRIC RANK
23.0%
FEMALE POVERTY AMONG 18-24 YEAR OLDS
0.0/ 100
METRIC RATING
304th/ 347
METRIC RANK
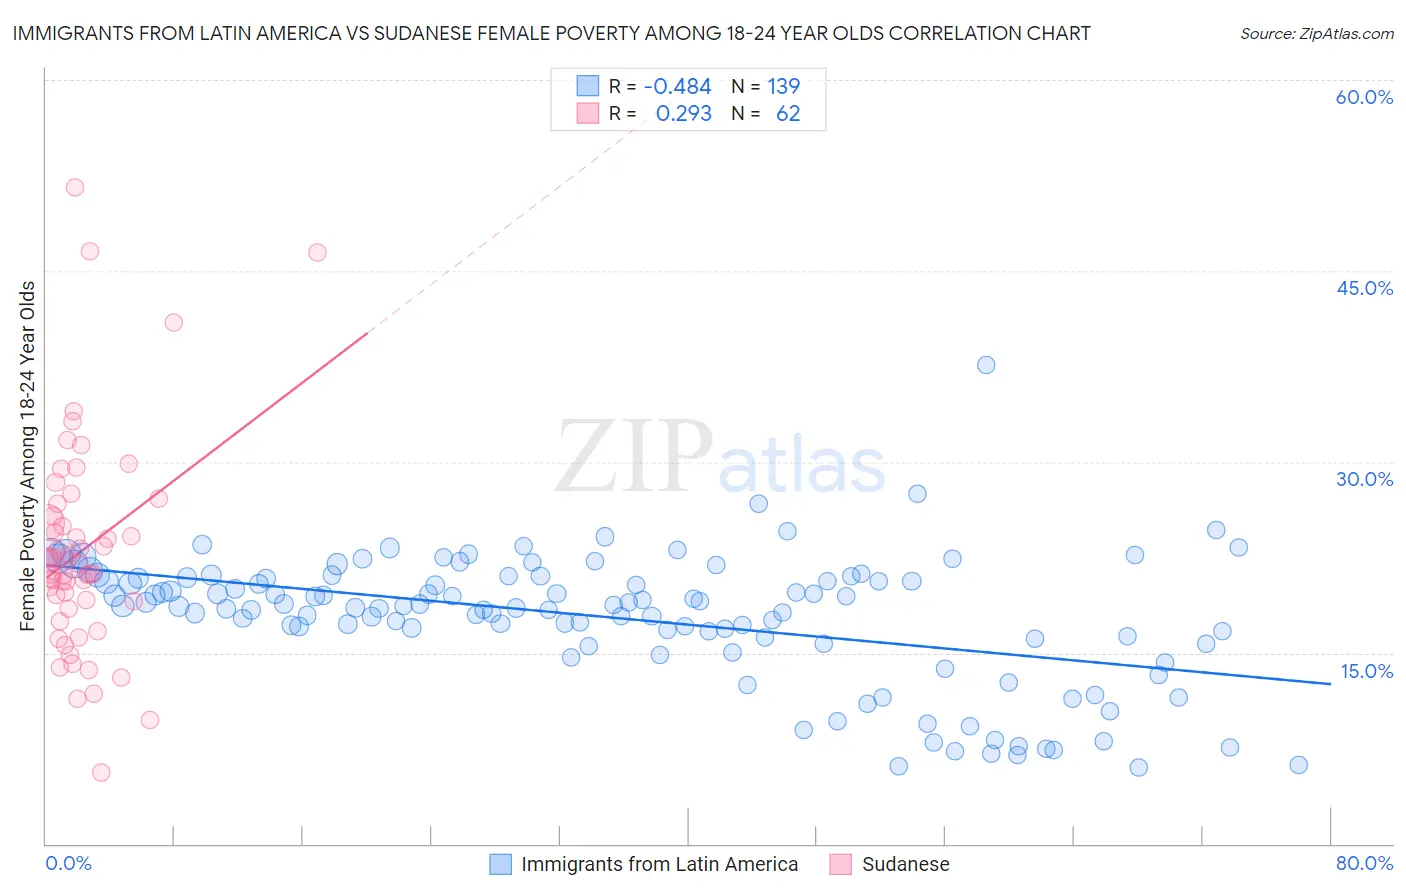
Immigrants from Latin America vs Sudanese Female Poverty Among 18-24 Year Olds Correlation Chart
The statistical analysis conducted on geographies consisting of 529,992,515 people shows a moderate negative correlation between the proportion of Immigrants from Latin America and poverty level among females between the ages 18 and 24 in the United States with a correlation coefficient (R) of -0.484 and weighted average of 19.7%. Similarly, the statistical analysis conducted on geographies consisting of 109,658,640 people shows a weak positive correlation between the proportion of Sudanese and poverty level among females between the ages 18 and 24 in the United States with a correlation coefficient (R) of 0.293 and weighted average of 23.0%, a difference of 16.6%.
Female Poverty Among 18-24 Year Olds Correlation Summary
| Measurement | Immigrants from Latin America | Sudanese |
| Minimum | 6.0% | 5.6% |
| Maximum | 37.6% | 51.6% |
| Range | 31.6% | 46.0% |
| Mean | 17.8% | 23.0% |
| Median | 18.7% | 22.1% |
| Interquartile 25% (IQ1) | 16.1% | 19.1% |
| Interquartile 75% (IQ3) | 20.9% | 25.7% |
| Interquartile Range (IQR) | 4.8% | 6.7% |
| Standard Deviation (Sample) | 5.1% | 8.4% |
| Standard Deviation (Population) | 5.1% | 8.4% |
Similar Demographics by Female Poverty Among 18-24 Year Olds
Demographics Similar to Immigrants from Latin America by Female Poverty Among 18-24 Year Olds
In terms of female poverty among 18-24 year olds, the demographic groups most similar to Immigrants from Latin America are Immigrants from Oceania (19.7%, a difference of 0.010%), Syrian (19.8%, a difference of 0.090%), Immigrants from Eastern Asia (19.8%, a difference of 0.13%), Immigrants from Austria (19.7%, a difference of 0.15%), and Yugoslavian (19.8%, a difference of 0.18%).
| Demographics | Rating | Rank | Female Poverty Among 18-24 Year Olds |
| Pennsylvania Germans | 85.5 /100 | #141 | Excellent 19.7% |
| Panamanians | 84.6 /100 | #142 | Excellent 19.7% |
| Slavs | 84.4 /100 | #143 | Excellent 19.7% |
| Immigrants | Northern Africa | 84.1 /100 | #144 | Excellent 19.7% |
| Canadians | 83.8 /100 | #145 | Excellent 19.7% |
| Immigrants | Bosnia and Herzegovina | 83.6 /100 | #146 | Excellent 19.7% |
| Immigrants | Austria | 83.1 /100 | #147 | Excellent 19.7% |
| Immigrants | Latin America | 81.3 /100 | #148 | Excellent 19.7% |
| Immigrants | Oceania | 81.2 /100 | #149 | Excellent 19.7% |
| Syrians | 80.2 /100 | #150 | Excellent 19.8% |
| Immigrants | Eastern Asia | 79.7 /100 | #151 | Good 19.8% |
| Yugoslavians | 79.0 /100 | #152 | Good 19.8% |
| Immigrants | Japan | 78.1 /100 | #153 | Good 19.8% |
| Immigrants | Zimbabwe | 76.7 /100 | #154 | Good 19.8% |
| Hungarians | 76.6 /100 | #155 | Good 19.8% |
Demographics Similar to Sudanese by Female Poverty Among 18-24 Year Olds
In terms of female poverty among 18-24 year olds, the demographic groups most similar to Sudanese are Immigrants from Kuwait (23.0%, a difference of 0.050%), Senegalese (23.0%, a difference of 0.14%), Iroquois (22.9%, a difference of 0.30%), Seminole (22.9%, a difference of 0.69%), and African (22.8%, a difference of 0.77%).
| Demographics | Rating | Rank | Female Poverty Among 18-24 Year Olds |
| Inupiat | 0.0 /100 | #297 | Tragic 22.6% |
| Central American Indians | 0.0 /100 | #298 | Tragic 22.6% |
| Cherokee | 0.0 /100 | #299 | Tragic 22.7% |
| Africans | 0.0 /100 | #300 | Tragic 22.8% |
| Seminole | 0.0 /100 | #301 | Tragic 22.9% |
| Iroquois | 0.0 /100 | #302 | Tragic 22.9% |
| Senegalese | 0.0 /100 | #303 | Tragic 23.0% |
| Sudanese | 0.0 /100 | #304 | Tragic 23.0% |
| Immigrants | Kuwait | 0.0 /100 | #305 | Tragic 23.0% |
| Paiute | 0.0 /100 | #306 | Tragic 23.3% |
| Cree | 0.0 /100 | #307 | Tragic 23.4% |
| Immigrants | Sudan | 0.0 /100 | #308 | Tragic 23.5% |
| Blackfeet | 0.0 /100 | #309 | Tragic 23.6% |
| Comanche | 0.0 /100 | #310 | Tragic 23.6% |
| Potawatomi | 0.0 /100 | #311 | Tragic 23.7% |