Immigrants from Albania vs Sudanese Female Poverty Among 18-24 Year Olds
COMPARE
Immigrants from Albania
Sudanese
Female Poverty Among 18-24 Year Olds
Female Poverty Among 18-24 Year Olds Comparison
Immigrants from Albania
Sudanese
18.5%
FEMALE POVERTY AMONG 18-24 YEAR OLDS
99.8/ 100
METRIC RATING
61st/ 347
METRIC RANK
23.0%
FEMALE POVERTY AMONG 18-24 YEAR OLDS
0.0/ 100
METRIC RATING
304th/ 347
METRIC RANK
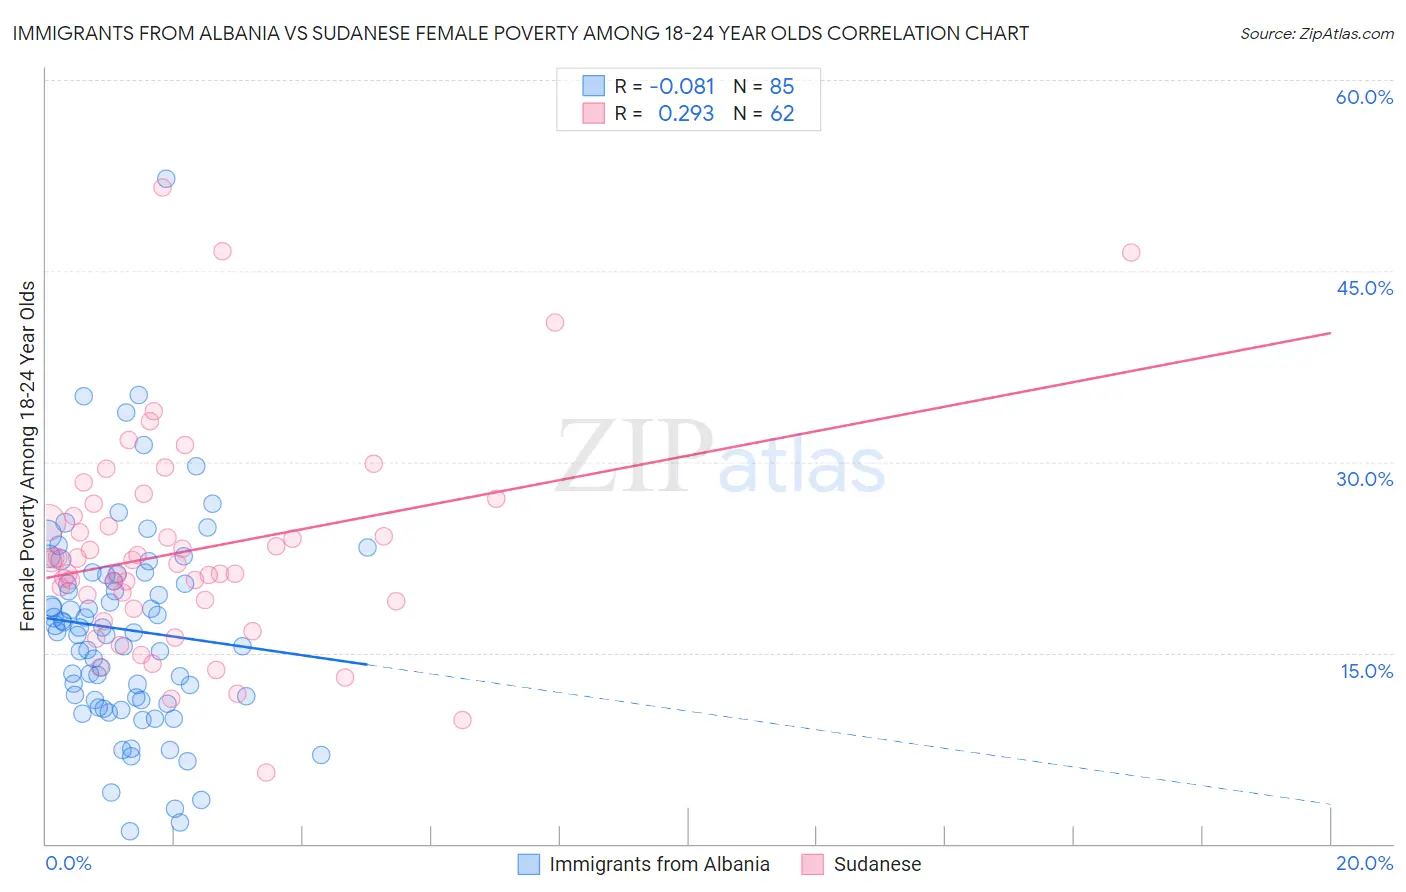
Immigrants from Albania vs Sudanese Female Poverty Among 18-24 Year Olds Correlation Chart
The statistical analysis conducted on geographies consisting of 118,032,486 people shows a slight negative correlation between the proportion of Immigrants from Albania and poverty level among females between the ages 18 and 24 in the United States with a correlation coefficient (R) of -0.081 and weighted average of 18.5%. Similarly, the statistical analysis conducted on geographies consisting of 109,658,640 people shows a weak positive correlation between the proportion of Sudanese and poverty level among females between the ages 18 and 24 in the United States with a correlation coefficient (R) of 0.293 and weighted average of 23.0%, a difference of 24.2%.
Female Poverty Among 18-24 Year Olds Correlation Summary
| Measurement | Immigrants from Albania | Sudanese |
| Minimum | 1.00% | 5.6% |
| Maximum | 52.3% | 51.6% |
| Range | 51.3% | 46.0% |
| Mean | 16.8% | 23.0% |
| Median | 16.7% | 22.1% |
| Interquartile 25% (IQ1) | 11.3% | 19.1% |
| Interquartile 75% (IQ3) | 21.2% | 25.7% |
| Interquartile Range (IQR) | 9.9% | 6.7% |
| Standard Deviation (Sample) | 8.2% | 8.4% |
| Standard Deviation (Population) | 8.2% | 8.4% |
Similar Demographics by Female Poverty Among 18-24 Year Olds
Demographics Similar to Immigrants from Albania by Female Poverty Among 18-24 Year Olds
In terms of female poverty among 18-24 year olds, the demographic groups most similar to Immigrants from Albania are Immigrants from Brazil (18.5%, a difference of 0.040%), Greek (18.5%, a difference of 0.070%), Immigrants from Belarus (18.5%, a difference of 0.080%), Immigrants from Asia (18.6%, a difference of 0.11%), and Immigrants from Scotland (18.6%, a difference of 0.14%).
| Demographics | Rating | Rank | Female Poverty Among 18-24 Year Olds |
| Immigrants | Egypt | 99.9 /100 | #54 | Exceptional 18.4% |
| Albanians | 99.9 /100 | #55 | Exceptional 18.4% |
| Argentineans | 99.9 /100 | #56 | Exceptional 18.4% |
| Immigrants | Italy | 99.9 /100 | #57 | Exceptional 18.4% |
| Immigrants | Ukraine | 99.9 /100 | #58 | Exceptional 18.4% |
| Egyptians | 99.9 /100 | #59 | Exceptional 18.5% |
| Immigrants | Brazil | 99.8 /100 | #60 | Exceptional 18.5% |
| Immigrants | Albania | 99.8 /100 | #61 | Exceptional 18.5% |
| Greeks | 99.8 /100 | #62 | Exceptional 18.5% |
| Immigrants | Belarus | 99.8 /100 | #63 | Exceptional 18.5% |
| Immigrants | Asia | 99.8 /100 | #64 | Exceptional 18.6% |
| Immigrants | Scotland | 99.8 /100 | #65 | Exceptional 18.6% |
| Jordanians | 99.8 /100 | #66 | Exceptional 18.6% |
| Immigrants | Korea | 99.8 /100 | #67 | Exceptional 18.6% |
| Brazilians | 99.8 /100 | #68 | Exceptional 18.6% |
Demographics Similar to Sudanese by Female Poverty Among 18-24 Year Olds
In terms of female poverty among 18-24 year olds, the demographic groups most similar to Sudanese are Immigrants from Kuwait (23.0%, a difference of 0.050%), Senegalese (23.0%, a difference of 0.14%), Iroquois (22.9%, a difference of 0.30%), Seminole (22.9%, a difference of 0.69%), and African (22.8%, a difference of 0.77%).
| Demographics | Rating | Rank | Female Poverty Among 18-24 Year Olds |
| Inupiat | 0.0 /100 | #297 | Tragic 22.6% |
| Central American Indians | 0.0 /100 | #298 | Tragic 22.6% |
| Cherokee | 0.0 /100 | #299 | Tragic 22.7% |
| Africans | 0.0 /100 | #300 | Tragic 22.8% |
| Seminole | 0.0 /100 | #301 | Tragic 22.9% |
| Iroquois | 0.0 /100 | #302 | Tragic 22.9% |
| Senegalese | 0.0 /100 | #303 | Tragic 23.0% |
| Sudanese | 0.0 /100 | #304 | Tragic 23.0% |
| Immigrants | Kuwait | 0.0 /100 | #305 | Tragic 23.0% |
| Paiute | 0.0 /100 | #306 | Tragic 23.3% |
| Cree | 0.0 /100 | #307 | Tragic 23.4% |
| Immigrants | Sudan | 0.0 /100 | #308 | Tragic 23.5% |
| Blackfeet | 0.0 /100 | #309 | Tragic 23.6% |
| Comanche | 0.0 /100 | #310 | Tragic 23.6% |
| Potawatomi | 0.0 /100 | #311 | Tragic 23.7% |