Crow vs Sudanese Median Female Earnings
COMPARE
Crow
Sudanese
Median Female Earnings
Median Female Earnings Comparison
Crow
Sudanese
$35,266
MEDIAN FEMALE EARNINGS
0.0/ 100
METRIC RATING
304th/ 347
METRIC RANK
$38,215
MEDIAN FEMALE EARNINGS
4.4/ 100
METRIC RATING
235th/ 347
METRIC RANK
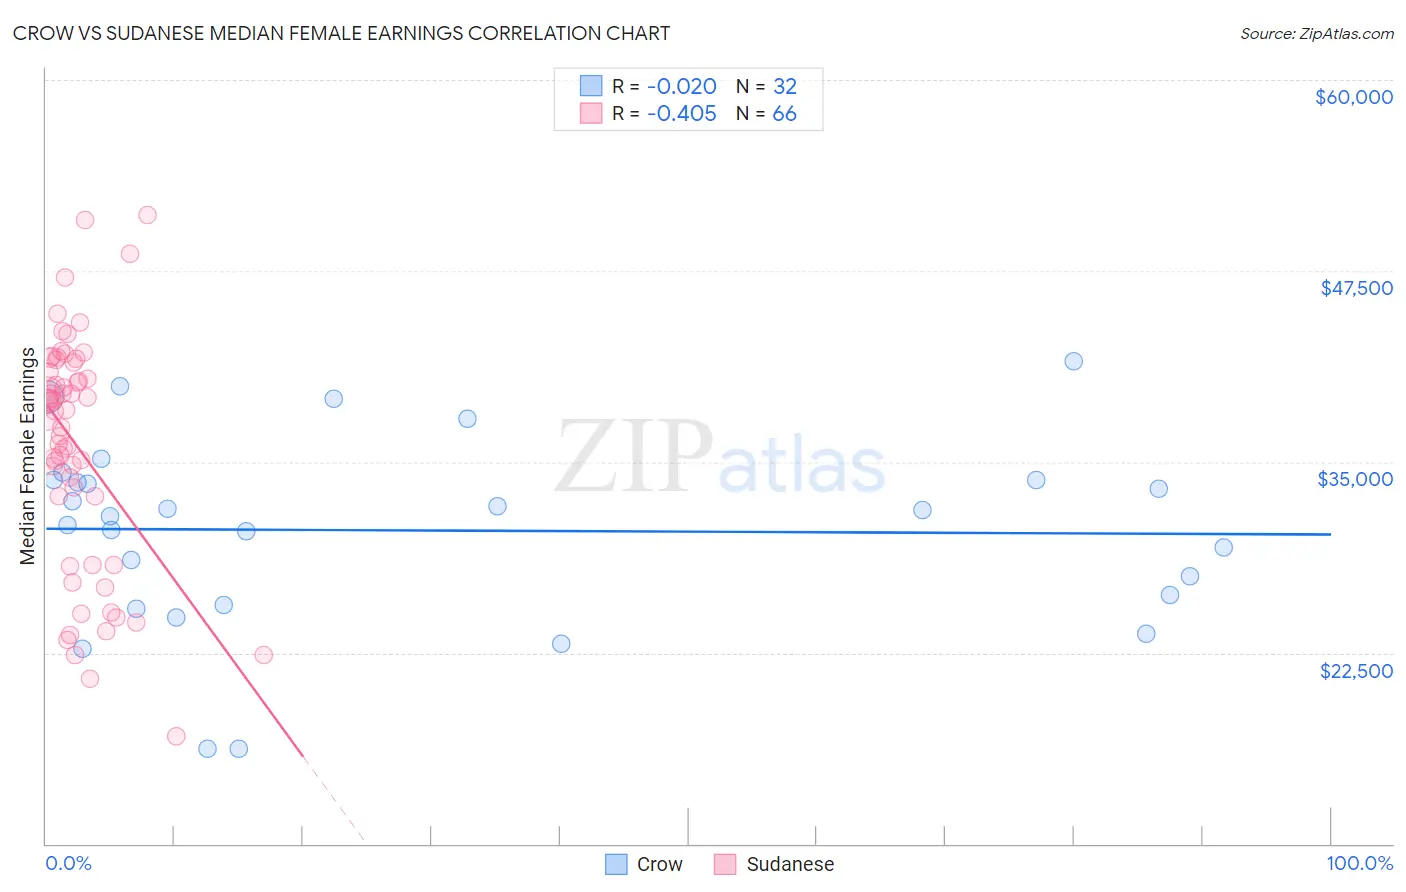
Crow vs Sudanese Median Female Earnings Correlation Chart
The statistical analysis conducted on geographies consisting of 59,190,197 people shows no correlation between the proportion of Crow and median female earnings in the United States with a correlation coefficient (R) of -0.020 and weighted average of $35,266. Similarly, the statistical analysis conducted on geographies consisting of 110,138,863 people shows a moderate negative correlation between the proportion of Sudanese and median female earnings in the United States with a correlation coefficient (R) of -0.405 and weighted average of $38,215, a difference of 8.4%.
Median Female Earnings Correlation Summary
| Measurement | Crow | Sudanese |
| Minimum | $16,250 | $17,051 |
| Maximum | $41,563 | $51,172 |
| Range | $25,313 | $34,121 |
| Mean | $30,518 | $36,010 |
| Median | $31,642 | $38,359 |
| Interquartile 25% (IQ1) | $25,950 | $32,734 |
| Interquartile 75% (IQ3) | $33,807 | $41,525 |
| Interquartile Range (IQR) | $7,857 | $8,791 |
| Standard Deviation (Sample) | $6,205 | $7,666 |
| Standard Deviation (Population) | $6,108 | $7,607 |
Similar Demographics by Median Female Earnings
Demographics Similar to Crow by Median Female Earnings
In terms of median female earnings, the demographic groups most similar to Crow are Immigrants from Latin America ($35,307, a difference of 0.11%), Black/African American ($35,315, a difference of 0.14%), Pima ($35,326, a difference of 0.17%), Yuman ($35,377, a difference of 0.31%), and Bahamian ($35,125, a difference of 0.40%).
| Demographics | Rating | Rank | Median Female Earnings |
| Hmong | 0.0 /100 | #297 | Tragic $35,498 |
| Immigrants | Micronesia | 0.0 /100 | #298 | Tragic $35,477 |
| Immigrants | Guatemala | 0.0 /100 | #299 | Tragic $35,444 |
| Yuman | 0.0 /100 | #300 | Tragic $35,377 |
| Pima | 0.0 /100 | #301 | Tragic $35,326 |
| Blacks/African Americans | 0.0 /100 | #302 | Tragic $35,315 |
| Immigrants | Latin America | 0.0 /100 | #303 | Tragic $35,307 |
| Crow | 0.0 /100 | #304 | Tragic $35,266 |
| Bahamians | 0.0 /100 | #305 | Tragic $35,125 |
| Fijians | 0.0 /100 | #306 | Tragic $35,114 |
| Sioux | 0.0 /100 | #307 | Tragic $35,063 |
| Immigrants | Bahamas | 0.0 /100 | #308 | Tragic $35,027 |
| Hondurans | 0.0 /100 | #309 | Tragic $35,013 |
| Chippewa | 0.0 /100 | #310 | Tragic $35,003 |
| Ute | 0.0 /100 | #311 | Tragic $34,960 |
Demographics Similar to Sudanese by Median Female Earnings
In terms of median female earnings, the demographic groups most similar to Sudanese are Liberian ($38,215, a difference of 0.0%), Immigrants from Cabo Verde ($38,208, a difference of 0.020%), Alaska Native ($38,202, a difference of 0.040%), English ($38,196, a difference of 0.050%), and Finnish ($38,173, a difference of 0.11%).
| Demographics | Rating | Rank | Median Female Earnings |
| Sub-Saharan Africans | 6.2 /100 | #228 | Tragic $38,391 |
| Belgians | 6.1 /100 | #229 | Tragic $38,382 |
| Basques | 5.7 /100 | #230 | Tragic $38,352 |
| Somalis | 5.5 /100 | #231 | Tragic $38,333 |
| Scandinavians | 5.2 /100 | #232 | Tragic $38,306 |
| Tongans | 5.1 /100 | #233 | Tragic $38,288 |
| Celtics | 5.0 /100 | #234 | Tragic $38,283 |
| Sudanese | 4.4 /100 | #235 | Tragic $38,215 |
| Liberians | 4.4 /100 | #236 | Tragic $38,215 |
| Immigrants | Cabo Verde | 4.3 /100 | #237 | Tragic $38,208 |
| Alaska Natives | 4.3 /100 | #238 | Tragic $38,202 |
| English | 4.2 /100 | #239 | Tragic $38,196 |
| Finns | 4.0 /100 | #240 | Tragic $38,173 |
| Spanish | 3.5 /100 | #241 | Tragic $38,098 |
| Immigrants | Burma/Myanmar | 3.0 /100 | #242 | Tragic $38,028 |