Croatian vs Pakistani Disability Age 35 to 64
COMPARE
Croatian
Pakistani
Disability Age 35 to 64
Disability Age 35 to 64 Comparison
Croatians
Pakistanis
11.0%
DISABILITY AGE 35 TO 64
73.1/ 100
METRIC RATING
160th/ 347
METRIC RANK
11.1%
DISABILITY AGE 35 TO 64
65.8/ 100
METRIC RATING
164th/ 347
METRIC RANK
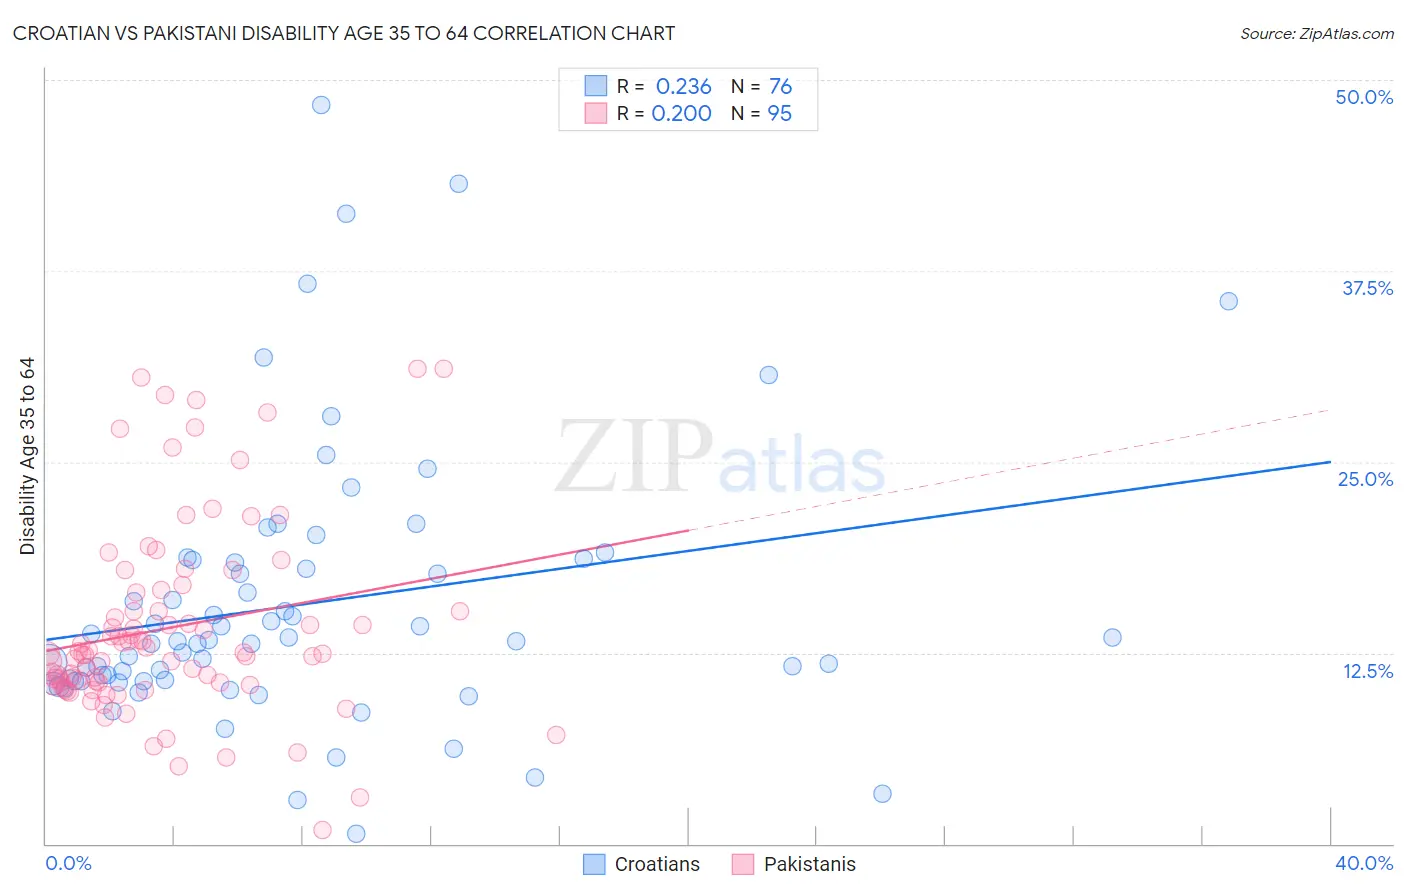
Croatian vs Pakistani Disability Age 35 to 64 Correlation Chart
The statistical analysis conducted on geographies consisting of 375,480,501 people shows a weak positive correlation between the proportion of Croatians and percentage of population with a disability between the ages 34 and 64 in the United States with a correlation coefficient (R) of 0.236 and weighted average of 11.0%. Similarly, the statistical analysis conducted on geographies consisting of 335,157,487 people shows a poor positive correlation between the proportion of Pakistanis and percentage of population with a disability between the ages 34 and 64 in the United States with a correlation coefficient (R) of 0.200 and weighted average of 11.1%, a difference of 0.71%.
Disability Age 35 to 64 Correlation Summary
| Measurement | Croatian | Pakistani |
| Minimum | 0.68% | 0.93% |
| Maximum | 48.4% | 31.1% |
| Range | 47.7% | 30.1% |
| Mean | 15.7% | 14.1% |
| Median | 13.3% | 12.5% |
| Interquartile 25% (IQ1) | 10.6% | 10.5% |
| Interquartile 75% (IQ3) | 18.5% | 16.5% |
| Interquartile Range (IQR) | 7.8% | 5.9% |
| Standard Deviation (Sample) | 8.9% | 6.3% |
| Standard Deviation (Population) | 8.9% | 6.2% |
Demographics Similar to Croatians and Pakistanis by Disability Age 35 to 64
In terms of disability age 35 to 64, the demographic groups most similar to Croatians are Serbian (11.0%, a difference of 0.050%), Immigrants from North America (11.0%, a difference of 0.20%), Guyanese (11.0%, a difference of 0.21%), Immigrants from Guyana (11.1%, a difference of 0.30%), and Immigrants from Sierra Leone (11.0%, a difference of 0.34%). Similarly, the demographic groups most similar to Pakistanis are Immigrants from Western Europe (11.1%, a difference of 0.050%), Immigrants from St. Vincent and the Grenadines (11.1%, a difference of 0.080%), Immigrants from Haiti (11.1%, a difference of 0.17%), Austrian (11.1%, a difference of 0.23%), and Immigrants from Grenada (11.1%, a difference of 0.24%).
| Demographics | Rating | Rank | Disability Age 35 to 64 |
| Ukrainians | 78.0 /100 | #152 | Good 11.0% |
| Immigrants | England | 77.4 /100 | #153 | Good 11.0% |
| Immigrants | Canada | 76.7 /100 | #154 | Good 11.0% |
| Moroccans | 76.4 /100 | #155 | Good 11.0% |
| Immigrants | Sierra Leone | 76.2 /100 | #156 | Good 11.0% |
| Guyanese | 75.1 /100 | #157 | Good 11.0% |
| Immigrants | North America | 74.9 /100 | #158 | Good 11.0% |
| Serbians | 73.6 /100 | #159 | Good 11.0% |
| Croatians | 73.1 /100 | #160 | Good 11.0% |
| Immigrants | Guyana | 70.1 /100 | #161 | Good 11.1% |
| Immigrants | Grenada | 68.4 /100 | #162 | Good 11.1% |
| Immigrants | St. Vincent and the Grenadines | 66.6 /100 | #163 | Good 11.1% |
| Pakistanis | 65.8 /100 | #164 | Good 11.1% |
| Immigrants | Western Europe | 65.2 /100 | #165 | Good 11.1% |
| Immigrants | Haiti | 63.8 /100 | #166 | Good 11.1% |
| Austrians | 63.2 /100 | #167 | Good 11.1% |
| Central Americans | 59.1 /100 | #168 | Average 11.2% |
| Haitians | 59.0 /100 | #169 | Average 11.2% |
| Immigrants | Uganda | 58.0 /100 | #170 | Average 11.2% |
| Immigrants | Trinidad and Tobago | 55.9 /100 | #171 | Average 11.2% |
| Italians | 55.6 /100 | #172 | Average 11.2% |