Croatian vs Immigrants from Brazil Single Female Poverty
COMPARE
Croatian
Immigrants from Brazil
Single Female Poverty
Single Female Poverty Comparison
Croatians
Immigrants from Brazil
19.7%
SINGLE FEMALE POVERTY
98.1/ 100
METRIC RATING
97th/ 347
METRIC RANK
19.7%
SINGLE FEMALE POVERTY
98.2/ 100
METRIC RATING
96th/ 347
METRIC RANK
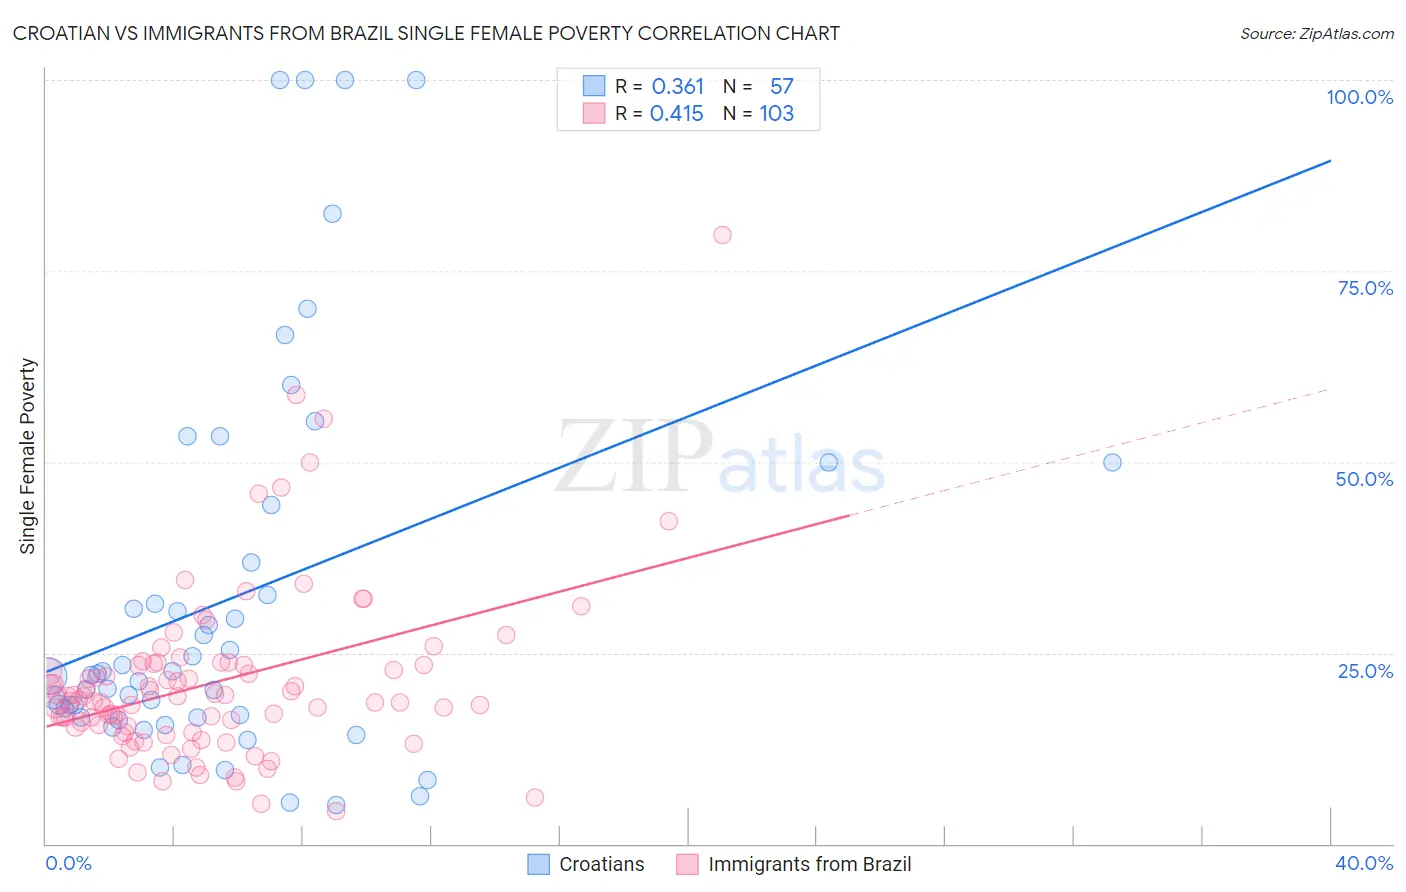
Croatian vs Immigrants from Brazil Single Female Poverty Correlation Chart
The statistical analysis conducted on geographies consisting of 368,567,193 people shows a mild positive correlation between the proportion of Croatians and poverty level among single females in the United States with a correlation coefficient (R) of 0.361 and weighted average of 19.7%. Similarly, the statistical analysis conducted on geographies consisting of 337,772,846 people shows a moderate positive correlation between the proportion of Immigrants from Brazil and poverty level among single females in the United States with a correlation coefficient (R) of 0.415 and weighted average of 19.7%, a difference of 0.090%.
Single Female Poverty Correlation Summary
| Measurement | Croatian | Immigrants from Brazil |
| Minimum | 5.0% | 4.3% |
| Maximum | 100.0% | 79.7% |
| Range | 95.0% | 75.4% |
| Mean | 32.0% | 21.1% |
| Median | 22.1% | 18.8% |
| Interquartile 25% (IQ1) | 16.5% | 15.2% |
| Interquartile 75% (IQ3) | 40.6% | 23.4% |
| Interquartile Range (IQR) | 24.0% | 8.2% |
| Standard Deviation (Sample) | 25.3% | 11.3% |
| Standard Deviation (Population) | 25.1% | 11.2% |
Demographics Similar to Croatians and Immigrants from Brazil by Single Female Poverty
In terms of single female poverty, the demographic groups most similar to Croatians are Immigrants from France (19.7%, a difference of 0.13%), Estonian (19.7%, a difference of 0.14%), Sierra Leonean (19.7%, a difference of 0.14%), Ukrainian (19.8%, a difference of 0.39%), and Romanian (19.6%, a difference of 0.51%). Similarly, the demographic groups most similar to Immigrants from Brazil are Estonian (19.7%, a difference of 0.050%), Immigrants from France (19.7%, a difference of 0.21%), Sierra Leonean (19.7%, a difference of 0.23%), Romanian (19.6%, a difference of 0.43%), and Ukrainian (19.8%, a difference of 0.48%).
| Demographics | Rating | Rank | Single Female Poverty |
| Greeks | 99.2 /100 | #86 | Exceptional 19.4% |
| Zimbabweans | 99.0 /100 | #87 | Exceptional 19.5% |
| Afghans | 99.0 /100 | #88 | Exceptional 19.5% |
| Immigrants | Ukraine | 99.0 /100 | #89 | Exceptional 19.5% |
| Immigrants | Lebanon | 98.8 /100 | #90 | Exceptional 19.6% |
| Soviet Union | 98.8 /100 | #91 | Exceptional 19.6% |
| Italians | 98.8 /100 | #92 | Exceptional 19.6% |
| Immigrants | Austria | 98.8 /100 | #93 | Exceptional 19.6% |
| Romanians | 98.6 /100 | #94 | Exceptional 19.6% |
| Estonians | 98.2 /100 | #95 | Exceptional 19.7% |
| Immigrants | Brazil | 98.2 /100 | #96 | Exceptional 19.7% |
| Croatians | 98.1 /100 | #97 | Exceptional 19.7% |
| Immigrants | France | 97.9 /100 | #98 | Exceptional 19.7% |
| Sierra Leoneans | 97.9 /100 | #99 | Exceptional 19.7% |
| Ukrainians | 97.6 /100 | #100 | Exceptional 19.8% |
| Immigrants | Belgium | 97.3 /100 | #101 | Exceptional 19.8% |
| Immigrants | Cameroon | 97.3 /100 | #102 | Exceptional 19.8% |
| Immigrants | Southern Europe | 97.1 /100 | #103 | Exceptional 19.9% |
| Chileans | 96.9 /100 | #104 | Exceptional 19.9% |
| Israelis | 96.9 /100 | #105 | Exceptional 19.9% |
| Ethiopians | 96.7 /100 | #106 | Exceptional 19.9% |