Croatian vs Immigrants from Central America High School Diploma
COMPARE
Croatian
Immigrants from Central America
High School Diploma
High School Diploma Comparison
Croatians
Immigrants from Central America
92.0%
HIGH SCHOOL DIPLOMA
100.0/ 100
METRIC RATING
10th/ 347
METRIC RANK
80.1%
HIGH SCHOOL DIPLOMA
0.0/ 100
METRIC RATING
344th/ 347
METRIC RANK
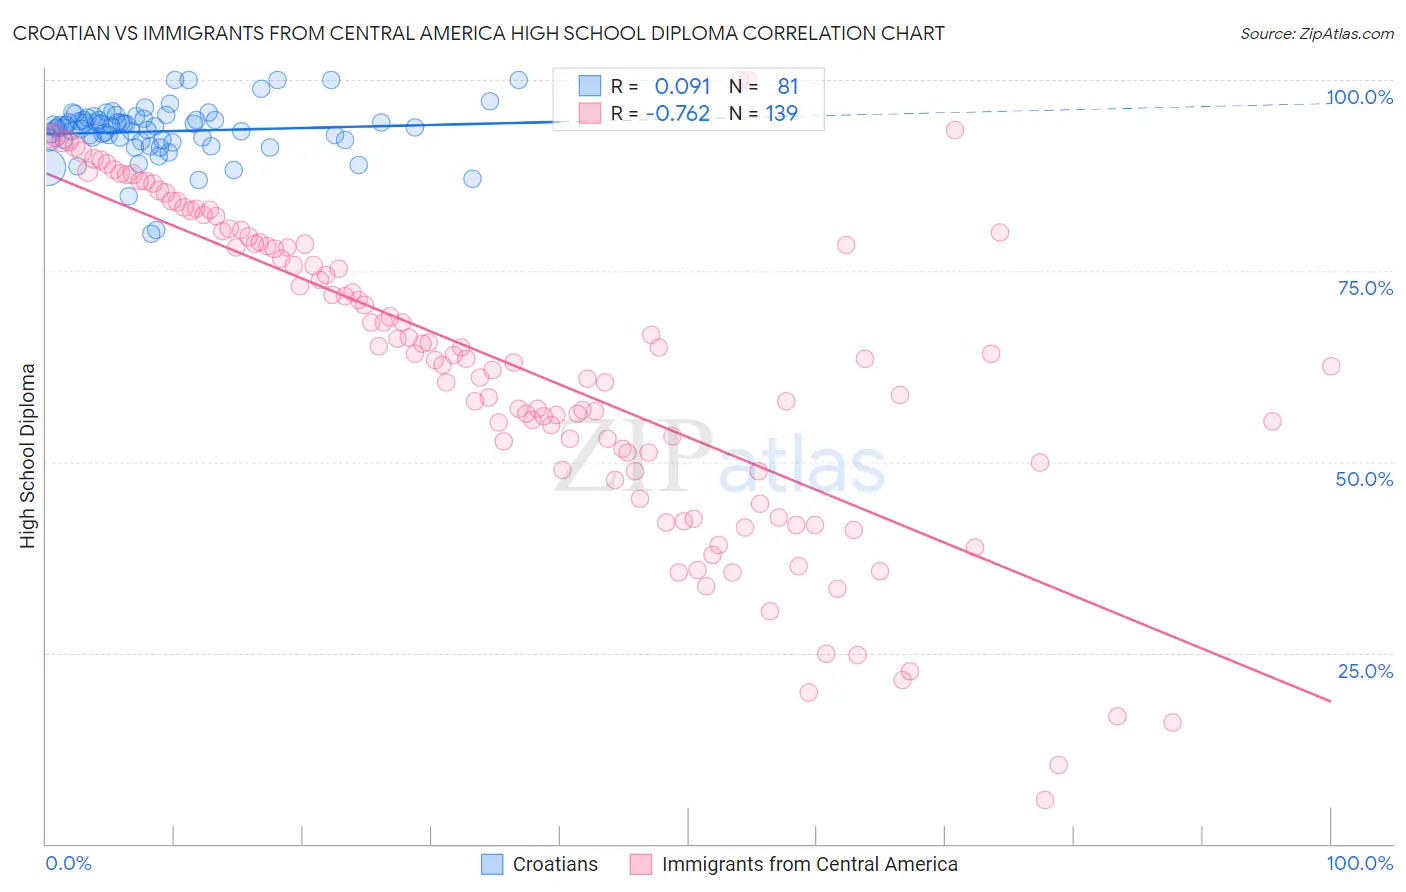
Croatian vs Immigrants from Central America High School Diploma Correlation Chart
The statistical analysis conducted on geographies consisting of 375,733,787 people shows a slight positive correlation between the proportion of Croatians and percentage of population with at least high school diploma education in the United States with a correlation coefficient (R) of 0.091 and weighted average of 92.0%. Similarly, the statistical analysis conducted on geographies consisting of 536,552,458 people shows a strong negative correlation between the proportion of Immigrants from Central America and percentage of population with at least high school diploma education in the United States with a correlation coefficient (R) of -0.762 and weighted average of 80.1%, a difference of 14.8%.
High School Diploma Correlation Summary
| Measurement | Croatian | Immigrants from Central America |
| Minimum | 79.8% | 5.7% |
| Maximum | 100.0% | 100.0% |
| Range | 20.2% | 94.3% |
| Mean | 93.3% | 62.8% |
| Median | 93.9% | 64.1% |
| Interquartile 25% (IQ1) | 92.1% | 50.0% |
| Interquartile 75% (IQ3) | 94.9% | 79.5% |
| Interquartile Range (IQR) | 2.8% | 29.5% |
| Standard Deviation (Sample) | 3.6% | 20.5% |
| Standard Deviation (Population) | 3.6% | 20.5% |
Similar Demographics by High School Diploma
Demographics Similar to Croatians by High School Diploma
In terms of high school diploma, the demographic groups most similar to Croatians are Latvian (92.0%, a difference of 0.030%), Chinese (92.0%, a difference of 0.050%), Slovak (92.0%, a difference of 0.060%), Immigrants from India (92.0%, a difference of 0.060%), and Eastern European (91.9%, a difference of 0.070%).
| Demographics | Rating | Rank | High School Diploma |
| Carpatho Rusyns | 100.0 /100 | #3 | Exceptional 92.1% |
| Lithuanians | 100.0 /100 | #4 | Exceptional 92.0% |
| Slovenes | 100.0 /100 | #5 | Exceptional 92.0% |
| Slovaks | 100.0 /100 | #6 | Exceptional 92.0% |
| Immigrants | India | 100.0 /100 | #7 | Exceptional 92.0% |
| Chinese | 100.0 /100 | #8 | Exceptional 92.0% |
| Latvians | 100.0 /100 | #9 | Exceptional 92.0% |
| Croatians | 100.0 /100 | #10 | Exceptional 92.0% |
| Eastern Europeans | 100.0 /100 | #11 | Exceptional 91.9% |
| Poles | 100.0 /100 | #12 | Exceptional 91.9% |
| Danes | 100.0 /100 | #13 | Exceptional 91.8% |
| Bulgarians | 100.0 /100 | #14 | Exceptional 91.8% |
| Luxembourgers | 100.0 /100 | #15 | Exceptional 91.7% |
| Finns | 100.0 /100 | #16 | Exceptional 91.7% |
| Immigrants | Singapore | 99.9 /100 | #17 | Exceptional 91.7% |
Demographics Similar to Immigrants from Central America by High School Diploma
In terms of high school diploma, the demographic groups most similar to Immigrants from Central America are Yakama (80.0%, a difference of 0.16%), Spanish American Indian (79.8%, a difference of 0.44%), Immigrants from Mexico (79.5%, a difference of 0.72%), Immigrants from El Salvador (80.8%, a difference of 0.86%), and Immigrants from Guatemala (81.4%, a difference of 1.5%).
| Demographics | Rating | Rank | High School Diploma |
| Immigrants | Latin America | 0.0 /100 | #333 | Tragic 82.1% |
| Tohono O'odham | 0.0 /100 | #334 | Tragic 82.1% |
| Guatemalans | 0.0 /100 | #335 | Tragic 82.0% |
| Immigrants | Dominican Republic | 0.0 /100 | #336 | Tragic 82.0% |
| Immigrants | Yemen | 0.0 /100 | #337 | Tragic 81.8% |
| Salvadorans | 0.0 /100 | #338 | Tragic 81.7% |
| Pima | 0.0 /100 | #339 | Tragic 81.6% |
| Houma | 0.0 /100 | #340 | Tragic 81.5% |
| Mexicans | 0.0 /100 | #341 | Tragic 81.4% |
| Immigrants | Guatemala | 0.0 /100 | #342 | Tragic 81.4% |
| Immigrants | El Salvador | 0.0 /100 | #343 | Tragic 80.8% |
| Immigrants | Central America | 0.0 /100 | #344 | Tragic 80.1% |
| Yakama | 0.0 /100 | #345 | Tragic 80.0% |
| Spanish American Indians | 0.0 /100 | #346 | Tragic 79.8% |
| Immigrants | Mexico | 0.0 /100 | #347 | Tragic 79.5% |