Croatian vs Cherokee Female Poverty Among 18-24 Year Olds
COMPARE
Croatian
Cherokee
Female Poverty Among 18-24 Year Olds
Female Poverty Among 18-24 Year Olds Comparison
Croatians
Cherokee
19.0%
FEMALE POVERTY AMONG 18-24 YEAR OLDS
99.1/ 100
METRIC RATING
88th/ 347
METRIC RANK
22.7%
FEMALE POVERTY AMONG 18-24 YEAR OLDS
0.0/ 100
METRIC RATING
299th/ 347
METRIC RANK
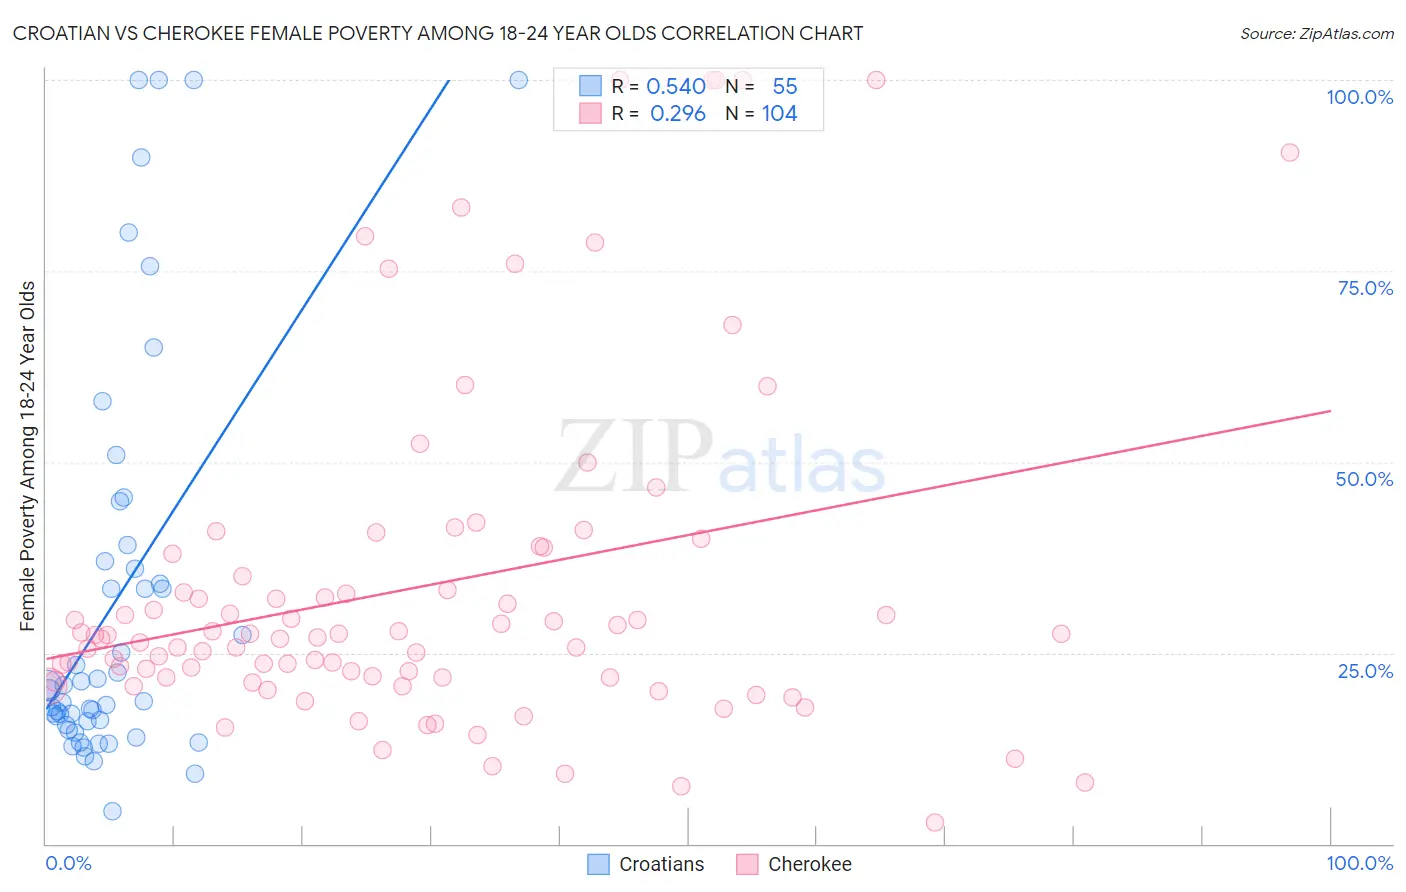
Croatian vs Cherokee Female Poverty Among 18-24 Year Olds Correlation Chart
The statistical analysis conducted on geographies consisting of 364,573,762 people shows a substantial positive correlation between the proportion of Croatians and poverty level among females between the ages 18 and 24 in the United States with a correlation coefficient (R) of 0.540 and weighted average of 19.0%. Similarly, the statistical analysis conducted on geographies consisting of 476,487,682 people shows a weak positive correlation between the proportion of Cherokee and poverty level among females between the ages 18 and 24 in the United States with a correlation coefficient (R) of 0.296 and weighted average of 22.7%, a difference of 19.6%.
Female Poverty Among 18-24 Year Olds Correlation Summary
| Measurement | Croatian | Cherokee |
| Minimum | 4.2% | 2.7% |
| Maximum | 100.0% | 100.0% |
| Range | 95.8% | 97.3% |
| Mean | 31.9% | 33.7% |
| Median | 20.1% | 27.2% |
| Interquartile 25% (IQ1) | 15.6% | 21.8% |
| Interquartile 75% (IQ3) | 37.0% | 36.5% |
| Interquartile Range (IQR) | 21.4% | 14.8% |
| Standard Deviation (Sample) | 26.4% | 22.2% |
| Standard Deviation (Population) | 26.2% | 22.1% |
Similar Demographics by Female Poverty Among 18-24 Year Olds
Demographics Similar to Croatians by Female Poverty Among 18-24 Year Olds
In terms of female poverty among 18-24 year olds, the demographic groups most similar to Croatians are Immigrants from Cabo Verde (19.0%, a difference of 0.020%), Afghan (19.0%, a difference of 0.050%), Romanian (19.0%, a difference of 0.14%), Immigrants from Jamaica (18.9%, a difference of 0.15%), and Immigrants from Iraq (18.9%, a difference of 0.16%).
| Demographics | Rating | Rank | Female Poverty Among 18-24 Year Olds |
| Japanese | 99.5 /100 | #81 | Exceptional 18.8% |
| Immigrants | Uruguay | 99.4 /100 | #82 | Exceptional 18.8% |
| Immigrants | Indonesia | 99.4 /100 | #83 | Exceptional 18.9% |
| Burmese | 99.2 /100 | #84 | Exceptional 18.9% |
| Immigrants | Armenia | 99.2 /100 | #85 | Exceptional 18.9% |
| Immigrants | Iraq | 99.2 /100 | #86 | Exceptional 18.9% |
| Immigrants | Jamaica | 99.2 /100 | #87 | Exceptional 18.9% |
| Croatians | 99.1 /100 | #88 | Exceptional 19.0% |
| Immigrants | Cabo Verde | 99.0 /100 | #89 | Exceptional 19.0% |
| Afghans | 99.0 /100 | #90 | Exceptional 19.0% |
| Romanians | 98.9 /100 | #91 | Exceptional 19.0% |
| Filipinos | 98.9 /100 | #92 | Exceptional 19.0% |
| Haitians | 98.9 /100 | #93 | Exceptional 19.0% |
| Ukrainians | 98.8 /100 | #94 | Exceptional 19.0% |
| Guamanians/Chamorros | 98.8 /100 | #95 | Exceptional 19.0% |
Demographics Similar to Cherokee by Female Poverty Among 18-24 Year Olds
In terms of female poverty among 18-24 year olds, the demographic groups most similar to Cherokee are Central American Indian (22.6%, a difference of 0.41%), Inupiat (22.6%, a difference of 0.47%), Menominee (22.5%, a difference of 0.62%), Shoshone (22.5%, a difference of 0.72%), and African (22.8%, a difference of 0.72%).
| Demographics | Rating | Rank | Female Poverty Among 18-24 Year Olds |
| Alaskan Athabascans | 0.0 /100 | #292 | Tragic 22.5% |
| U.S. Virgin Islanders | 0.0 /100 | #293 | Tragic 22.5% |
| Indonesians | 0.0 /100 | #294 | Tragic 22.5% |
| Shoshone | 0.0 /100 | #295 | Tragic 22.5% |
| Menominee | 0.0 /100 | #296 | Tragic 22.5% |
| Inupiat | 0.0 /100 | #297 | Tragic 22.6% |
| Central American Indians | 0.0 /100 | #298 | Tragic 22.6% |
| Cherokee | 0.0 /100 | #299 | Tragic 22.7% |
| Africans | 0.0 /100 | #300 | Tragic 22.8% |
| Seminole | 0.0 /100 | #301 | Tragic 22.9% |
| Iroquois | 0.0 /100 | #302 | Tragic 22.9% |
| Senegalese | 0.0 /100 | #303 | Tragic 23.0% |
| Sudanese | 0.0 /100 | #304 | Tragic 23.0% |
| Immigrants | Kuwait | 0.0 /100 | #305 | Tragic 23.0% |
| Paiute | 0.0 /100 | #306 | Tragic 23.3% |