Croatian vs Dutch West Indian Male Poverty
COMPARE
Croatian
Dutch West Indian
Male Poverty
Male Poverty Comparison
Croatians
Dutch West Indians
9.6%
MALE POVERTY
99.7/ 100
METRIC RATING
22nd/ 347
METRIC RANK
14.2%
MALE POVERTY
0.0/ 100
METRIC RATING
307th/ 347
METRIC RANK
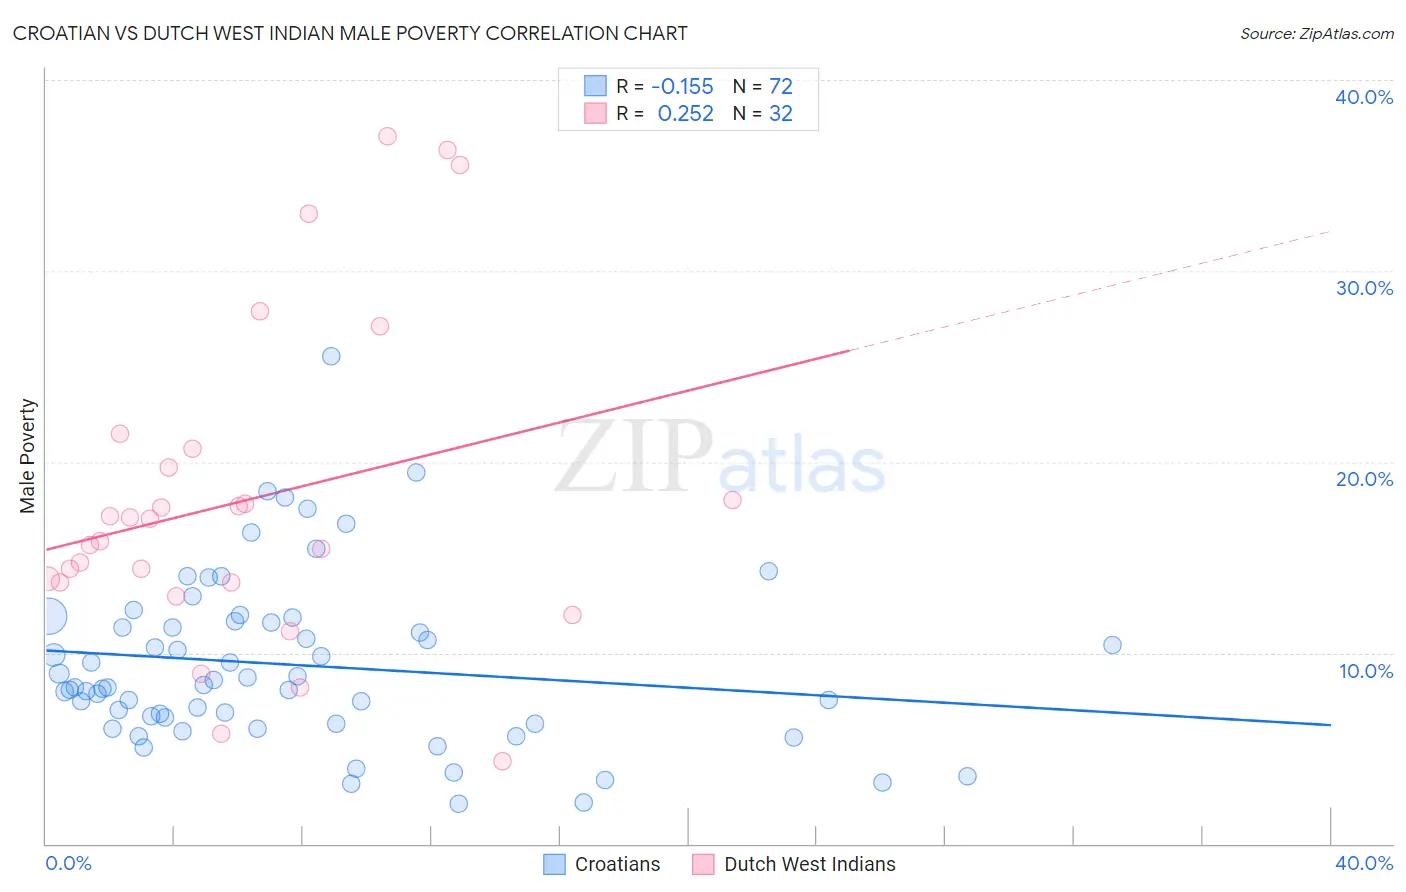
Croatian vs Dutch West Indian Male Poverty Correlation Chart
The statistical analysis conducted on geographies consisting of 375,378,387 people shows a poor negative correlation between the proportion of Croatians and poverty level among males in the United States with a correlation coefficient (R) of -0.155 and weighted average of 9.6%. Similarly, the statistical analysis conducted on geographies consisting of 85,761,209 people shows a weak positive correlation between the proportion of Dutch West Indians and poverty level among males in the United States with a correlation coefficient (R) of 0.252 and weighted average of 14.2%, a difference of 47.7%.
Male Poverty Correlation Summary
| Measurement | Croatian | Dutch West Indian |
| Minimum | 2.1% | 4.3% |
| Maximum | 25.5% | 37.0% |
| Range | 23.4% | 32.7% |
| Mean | 9.4% | 18.0% |
| Median | 8.2% | 16.4% |
| Interquartile 25% (IQ1) | 6.5% | 13.7% |
| Interquartile 75% (IQ3) | 11.6% | 20.2% |
| Interquartile Range (IQR) | 5.2% | 6.5% |
| Standard Deviation (Sample) | 4.4% | 8.4% |
| Standard Deviation (Population) | 4.4% | 8.2% |
Similar Demographics by Male Poverty
Demographics Similar to Croatians by Male Poverty
In terms of male poverty, the demographic groups most similar to Croatians are Italian (9.6%, a difference of 0.010%), Swedish (9.6%, a difference of 0.090%), Eastern European (9.6%, a difference of 0.23%), Immigrants from Scotland (9.6%, a difference of 0.25%), and Latvian (9.6%, a difference of 0.51%).
| Demographics | Rating | Rank | Male Poverty |
| Bhutanese | 99.8 /100 | #15 | Exceptional 9.5% |
| Luxembourgers | 99.8 /100 | #16 | Exceptional 9.5% |
| Norwegians | 99.8 /100 | #17 | Exceptional 9.5% |
| Lithuanians | 99.8 /100 | #18 | Exceptional 9.5% |
| Immigrants | Hong Kong | 99.7 /100 | #19 | Exceptional 9.6% |
| Latvians | 99.7 /100 | #20 | Exceptional 9.6% |
| Immigrants | Scotland | 99.7 /100 | #21 | Exceptional 9.6% |
| Croatians | 99.7 /100 | #22 | Exceptional 9.6% |
| Italians | 99.7 /100 | #23 | Exceptional 9.6% |
| Swedes | 99.7 /100 | #24 | Exceptional 9.6% |
| Eastern Europeans | 99.6 /100 | #25 | Exceptional 9.6% |
| Burmese | 99.6 /100 | #26 | Exceptional 9.7% |
| Danes | 99.6 /100 | #27 | Exceptional 9.7% |
| Immigrants | Korea | 99.6 /100 | #28 | Exceptional 9.7% |
| Greeks | 99.6 /100 | #29 | Exceptional 9.7% |
Demographics Similar to Dutch West Indians by Male Poverty
In terms of male poverty, the demographic groups most similar to Dutch West Indians are African (14.2%, a difference of 0.020%), Somali (14.3%, a difference of 0.40%), Seminole (14.3%, a difference of 0.60%), Creek (14.1%, a difference of 0.70%), and Immigrants from Bangladesh (14.1%, a difference of 0.77%).
| Demographics | Rating | Rank | Male Poverty |
| Immigrants | Mexico | 0.0 /100 | #300 | Tragic 14.0% |
| Immigrants | Senegal | 0.0 /100 | #301 | Tragic 14.0% |
| Immigrants | Caribbean | 0.0 /100 | #302 | Tragic 14.0% |
| Bahamians | 0.0 /100 | #303 | Tragic 14.1% |
| Senegalese | 0.0 /100 | #304 | Tragic 14.1% |
| Immigrants | Bangladesh | 0.0 /100 | #305 | Tragic 14.1% |
| Creek | 0.0 /100 | #306 | Tragic 14.1% |
| Dutch West Indians | 0.0 /100 | #307 | Tragic 14.2% |
| Africans | 0.0 /100 | #308 | Tragic 14.2% |
| Somalis | 0.0 /100 | #309 | Tragic 14.3% |
| Seminole | 0.0 /100 | #310 | Tragic 14.3% |
| Hondurans | 0.0 /100 | #311 | Tragic 14.3% |
| Choctaw | 0.0 /100 | #312 | Tragic 14.4% |
| Immigrants | Somalia | 0.0 /100 | #313 | Tragic 14.6% |
| Immigrants | Honduras | 0.0 /100 | #314 | Tragic 14.6% |