Immigrants from Somalia vs Immigrants from Panama Single Mother Poverty
COMPARE
Immigrants from Somalia
Immigrants from Panama
Single Mother Poverty
Single Mother Poverty Comparison
Immigrants from Somalia
Immigrants from Panama
33.4%
SINGLE MOTHER POVERTY
0.0/ 100
METRIC RATING
301st/ 347
METRIC RANK
29.8%
SINGLE MOTHER POVERTY
15.5/ 100
METRIC RATING
207th/ 347
METRIC RANK
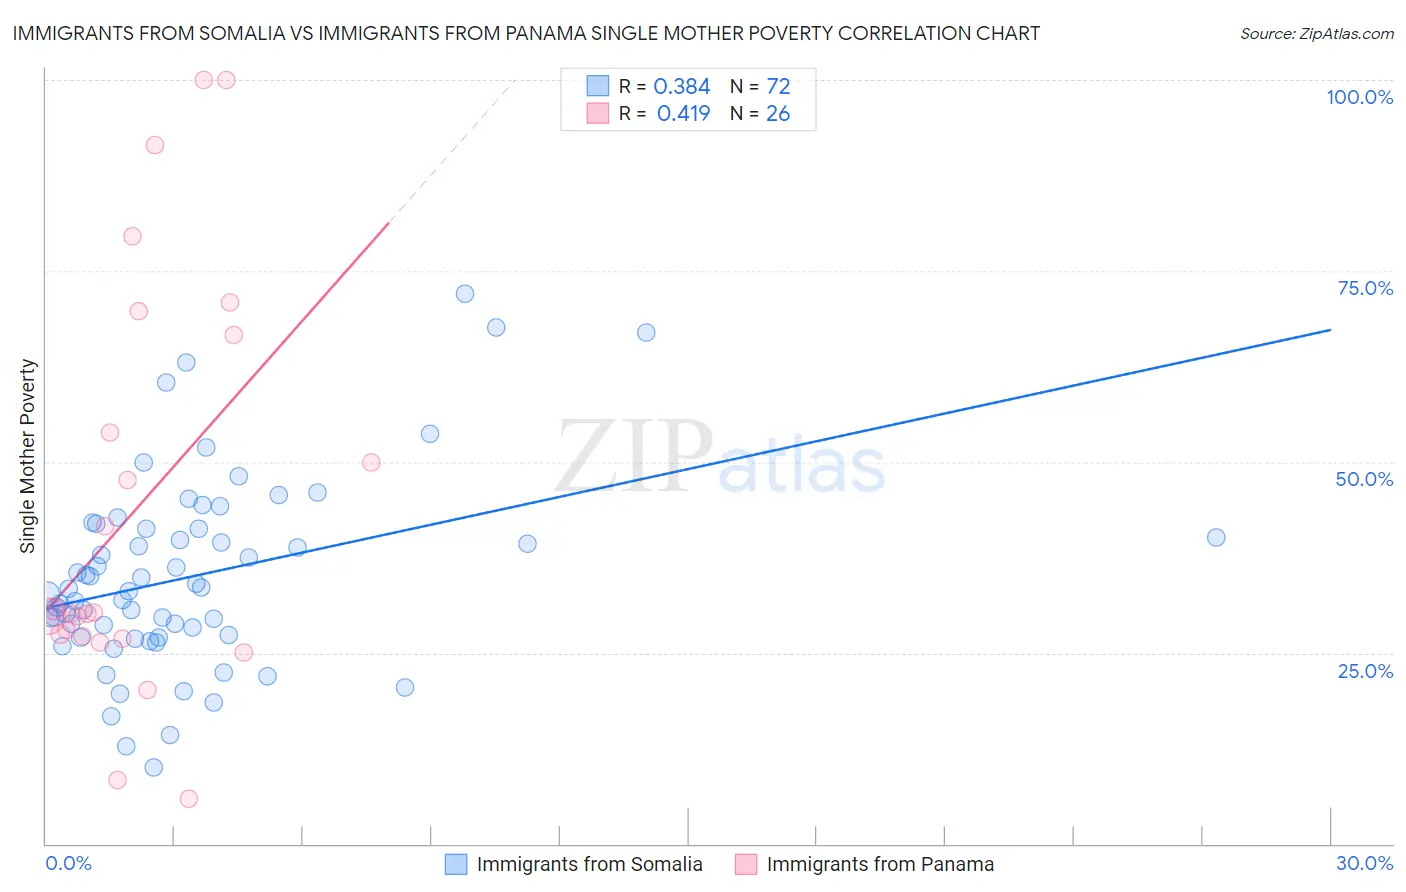
Immigrants from Somalia vs Immigrants from Panama Single Mother Poverty Correlation Chart
The statistical analysis conducted on geographies consisting of 91,810,835 people shows a mild positive correlation between the proportion of Immigrants from Somalia and poverty level among single mothers in the United States with a correlation coefficient (R) of 0.384 and weighted average of 33.4%. Similarly, the statistical analysis conducted on geographies consisting of 219,078,545 people shows a moderate positive correlation between the proportion of Immigrants from Panama and poverty level among single mothers in the United States with a correlation coefficient (R) of 0.419 and weighted average of 29.8%, a difference of 12.2%.
Single Mother Poverty Correlation Summary
| Measurement | Immigrants from Somalia | Immigrants from Panama |
| Minimum | 10.0% | 6.0% |
| Maximum | 72.0% | 100.0% |
| Range | 62.0% | 94.0% |
| Mean | 35.0% | 44.1% |
| Median | 33.2% | 30.2% |
| Interquartile 25% (IQ1) | 27.2% | 27.1% |
| Interquartile 75% (IQ3) | 41.2% | 66.7% |
| Interquartile Range (IQR) | 14.0% | 39.5% |
| Standard Deviation (Sample) | 12.5% | 26.9% |
| Standard Deviation (Population) | 12.4% | 26.4% |
Similar Demographics by Single Mother Poverty
Demographics Similar to Immigrants from Somalia by Single Mother Poverty
In terms of single mother poverty, the demographic groups most similar to Immigrants from Somalia are Arapaho (33.4%, a difference of 0.15%), Hispanic or Latino (33.3%, a difference of 0.24%), Immigrants from Guatemala (33.3%, a difference of 0.25%), African (33.3%, a difference of 0.33%), and American (33.5%, a difference of 0.41%).
| Demographics | Rating | Rank | Single Mother Poverty |
| French American Indians | 0.0 /100 | #294 | Tragic 33.1% |
| Yaqui | 0.0 /100 | #295 | Tragic 33.1% |
| Blackfeet | 0.0 /100 | #296 | Tragic 33.2% |
| Pennsylvania Germans | 0.0 /100 | #297 | Tragic 33.2% |
| Africans | 0.0 /100 | #298 | Tragic 33.3% |
| Immigrants | Guatemala | 0.0 /100 | #299 | Tragic 33.3% |
| Hispanics or Latinos | 0.0 /100 | #300 | Tragic 33.3% |
| Immigrants | Somalia | 0.0 /100 | #301 | Tragic 33.4% |
| Arapaho | 0.0 /100 | #302 | Tragic 33.4% |
| Americans | 0.0 /100 | #303 | Tragic 33.5% |
| Mexicans | 0.0 /100 | #304 | Tragic 33.6% |
| Immigrants | Central America | 0.0 /100 | #305 | Tragic 33.6% |
| Immigrants | Congo | 0.0 /100 | #306 | Tragic 33.8% |
| Comanche | 0.0 /100 | #307 | Tragic 33.9% |
| Immigrants | Mexico | 0.0 /100 | #308 | Tragic 34.0% |
Demographics Similar to Immigrants from Panama by Single Mother Poverty
In terms of single mother poverty, the demographic groups most similar to Immigrants from Panama are Immigrants from Haiti (29.7%, a difference of 0.030%), Czechoslovakian (29.7%, a difference of 0.050%), Immigrants from Guyana (29.8%, a difference of 0.070%), Immigrants (29.7%, a difference of 0.090%), and Swiss (29.7%, a difference of 0.15%).
| Demographics | Rating | Rank | Single Mother Poverty |
| Panamanians | 20.0 /100 | #200 | Fair 29.6% |
| Belgians | 18.8 /100 | #201 | Poor 29.7% |
| Malaysians | 17.4 /100 | #202 | Poor 29.7% |
| Swiss | 17.2 /100 | #203 | Poor 29.7% |
| Immigrants | Immigrants | 16.6 /100 | #204 | Poor 29.7% |
| Czechoslovakians | 16.1 /100 | #205 | Poor 29.7% |
| Immigrants | Haiti | 15.8 /100 | #206 | Poor 29.7% |
| Immigrants | Panama | 15.5 /100 | #207 | Poor 29.8% |
| Immigrants | Guyana | 14.7 /100 | #208 | Poor 29.8% |
| Irish | 13.9 /100 | #209 | Poor 29.8% |
| Haitians | 13.3 /100 | #210 | Poor 29.8% |
| Guyanese | 12.8 /100 | #211 | Poor 29.8% |
| Nicaraguans | 12.4 /100 | #212 | Poor 29.8% |
| Immigrants | Thailand | 12.0 /100 | #213 | Poor 29.9% |
| Liberians | 11.7 /100 | #214 | Poor 29.9% |