Creek vs Immigrants from Netherlands Kindergarten
COMPARE
Creek
Immigrants from Netherlands
Kindergarten
Kindergarten Comparison
Creek
Immigrants from Netherlands
98.4%
KINDERGARTEN
99.7/ 100
METRIC RATING
60th/ 347
METRIC RANK
98.3%
KINDERGARTEN
99.3/ 100
METRIC RATING
74th/ 347
METRIC RANK
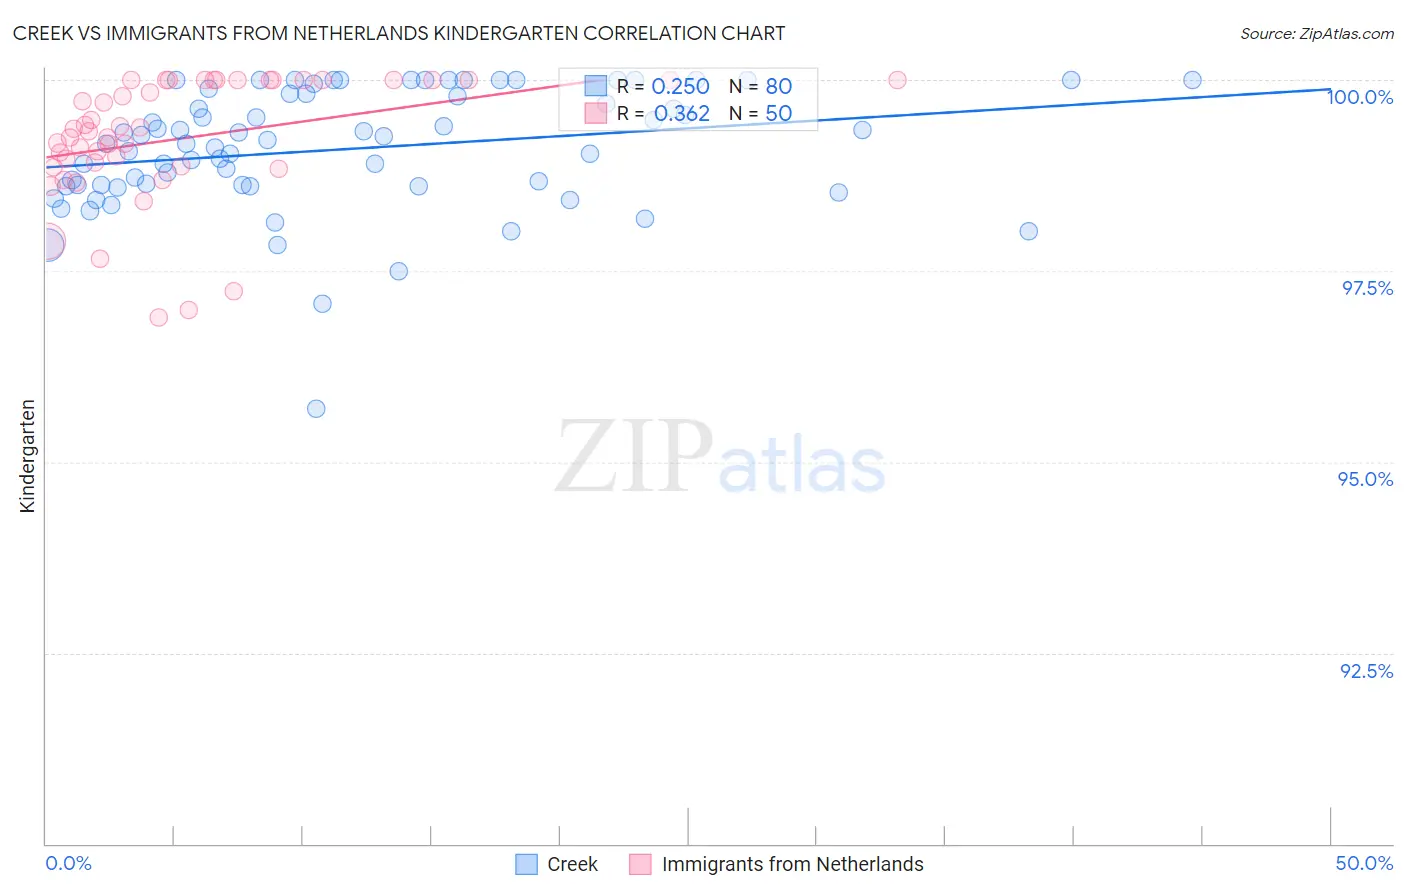
Creek vs Immigrants from Netherlands Kindergarten Correlation Chart
The statistical analysis conducted on geographies consisting of 178,480,663 people shows a weak positive correlation between the proportion of Creek and percentage of population with at least kindergarten education in the United States with a correlation coefficient (R) of 0.250 and weighted average of 98.4%. Similarly, the statistical analysis conducted on geographies consisting of 237,869,934 people shows a mild positive correlation between the proportion of Immigrants from Netherlands and percentage of population with at least kindergarten education in the United States with a correlation coefficient (R) of 0.362 and weighted average of 98.3%, a difference of 0.070%.
Kindergarten Correlation Summary
| Measurement | Creek | Immigrants from Netherlands |
| Minimum | 95.7% | 96.9% |
| Maximum | 100.0% | 100.0% |
| Range | 4.3% | 3.1% |
| Mean | 99.1% | 99.2% |
| Median | 99.2% | 99.3% |
| Interquartile 25% (IQ1) | 98.6% | 98.9% |
| Interquartile 75% (IQ3) | 99.8% | 100.0% |
| Interquartile Range (IQR) | 1.2% | 1.1% |
| Standard Deviation (Sample) | 0.80% | 0.81% |
| Standard Deviation (Population) | 0.80% | 0.80% |
Demographics Similar to Creek and Immigrants from Netherlands by Kindergarten
In terms of kindergarten, the demographic groups most similar to Creek are Bulgarian (98.4%, a difference of 0.0%), Immigrants from Canada (98.4%, a difference of 0.0%), Slavic (98.4%, a difference of 0.0%), New Zealander (98.4%, a difference of 0.0%), and Immigrants from North America (98.4%, a difference of 0.0%). Similarly, the demographic groups most similar to Immigrants from Netherlands are Cherokee (98.3%, a difference of 0.0%), Cajun (98.3%, a difference of 0.010%), Immigrants from England (98.3%, a difference of 0.010%), Delaware (98.3%, a difference of 0.010%), and Immigrants from Northern Europe (98.4%, a difference of 0.040%).
| Demographics | Rating | Rank | Kindergarten |
| Austrians | 99.8 /100 | #57 | Exceptional 98.4% |
| Bulgarians | 99.7 /100 | #58 | Exceptional 98.4% |
| Immigrants | Canada | 99.7 /100 | #59 | Exceptional 98.4% |
| Creek | 99.7 /100 | #60 | Exceptional 98.4% |
| Slavs | 99.7 /100 | #61 | Exceptional 98.4% |
| New Zealanders | 99.7 /100 | #62 | Exceptional 98.4% |
| Immigrants | North America | 99.7 /100 | #63 | Exceptional 98.4% |
| Greeks | 99.7 /100 | #64 | Exceptional 98.4% |
| Maltese | 99.7 /100 | #65 | Exceptional 98.4% |
| Cheyenne | 99.6 /100 | #66 | Exceptional 98.4% |
| Canadians | 99.6 /100 | #67 | Exceptional 98.4% |
| Immigrants | Northern Europe | 99.6 /100 | #68 | Exceptional 98.4% |
| Immigrants | Austria | 99.6 /100 | #69 | Exceptional 98.4% |
| Russians | 99.6 /100 | #70 | Exceptional 98.4% |
| Chickasaw | 99.6 /100 | #71 | Exceptional 98.4% |
| Serbians | 99.6 /100 | #72 | Exceptional 98.4% |
| Cajuns | 99.4 /100 | #73 | Exceptional 98.3% |
| Immigrants | Netherlands | 99.3 /100 | #74 | Exceptional 98.3% |
| Cherokee | 99.3 /100 | #75 | Exceptional 98.3% |
| Immigrants | England | 99.3 /100 | #76 | Exceptional 98.3% |
| Delaware | 99.3 /100 | #77 | Exceptional 98.3% |