Immigrants from Middle Africa vs Sierra Leonean Single Mother Poverty
COMPARE
Immigrants from Middle Africa
Sierra Leonean
Single Mother Poverty
Single Mother Poverty Comparison
Immigrants from Middle Africa
Sierra Leoneans
30.3%
SINGLE MOTHER POVERTY
3.5/ 100
METRIC RATING
233rd/ 347
METRIC RANK
27.4%
SINGLE MOTHER POVERTY
99.3/ 100
METRIC RATING
73rd/ 347
METRIC RANK
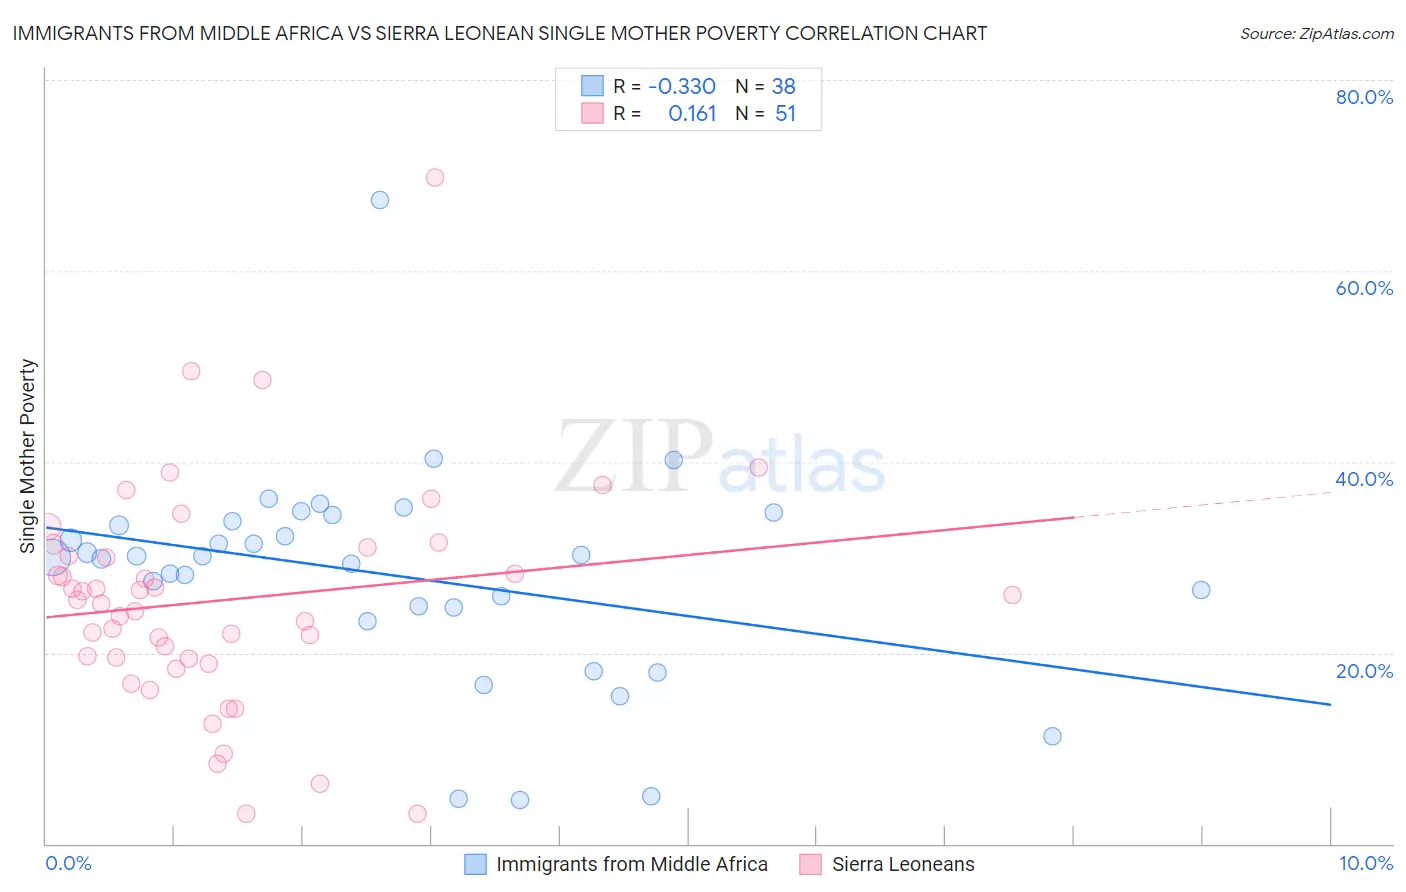
Immigrants from Middle Africa vs Sierra Leonean Single Mother Poverty Correlation Chart
The statistical analysis conducted on geographies consisting of 200,673,023 people shows a mild negative correlation between the proportion of Immigrants from Middle Africa and poverty level among single mothers in the United States with a correlation coefficient (R) of -0.330 and weighted average of 30.3%. Similarly, the statistical analysis conducted on geographies consisting of 83,072,166 people shows a poor positive correlation between the proportion of Sierra Leoneans and poverty level among single mothers in the United States with a correlation coefficient (R) of 0.161 and weighted average of 27.4%, a difference of 10.6%.
Single Mother Poverty Correlation Summary
| Measurement | Immigrants from Middle Africa | Sierra Leonean |
| Minimum | 4.5% | 3.1% |
| Maximum | 67.4% | 69.8% |
| Range | 62.9% | 66.7% |
| Mean | 28.1% | 25.5% |
| Median | 30.0% | 25.6% |
| Interquartile 25% (IQ1) | 24.8% | 19.4% |
| Interquartile 75% (IQ3) | 33.8% | 31.0% |
| Interquartile Range (IQR) | 9.0% | 11.6% |
| Standard Deviation (Sample) | 11.3% | 11.8% |
| Standard Deviation (Population) | 11.2% | 11.7% |
Similar Demographics by Single Mother Poverty
Demographics Similar to Immigrants from Middle Africa by Single Mother Poverty
In terms of single mother poverty, the demographic groups most similar to Immigrants from Middle Africa are Immigrants from Nicaragua (30.3%, a difference of 0.0%), Immigrants from Grenada (30.3%, a difference of 0.030%), Welsh (30.4%, a difference of 0.10%), Immigrants from St. Vincent and the Grenadines (30.4%, a difference of 0.14%), and Alaskan Athabascan (30.3%, a difference of 0.21%).
| Demographics | Rating | Rank | Single Mother Poverty |
| Scottish | 6.0 /100 | #226 | Tragic 30.1% |
| Immigrants | Liberia | 5.9 /100 | #227 | Tragic 30.1% |
| Spaniards | 5.4 /100 | #228 | Tragic 30.2% |
| Immigrants | Barbados | 5.0 /100 | #229 | Tragic 30.2% |
| English | 4.8 /100 | #230 | Tragic 30.2% |
| Dutch | 4.3 /100 | #231 | Tragic 30.2% |
| Alaskan Athabascans | 4.1 /100 | #232 | Tragic 30.3% |
| Immigrants | Middle Africa | 3.5 /100 | #233 | Tragic 30.3% |
| Immigrants | Nicaragua | 3.5 /100 | #234 | Tragic 30.3% |
| Immigrants | Grenada | 3.4 /100 | #235 | Tragic 30.3% |
| Welsh | 3.2 /100 | #236 | Tragic 30.4% |
| Immigrants | St. Vincent and the Grenadines | 3.1 /100 | #237 | Tragic 30.4% |
| Slovaks | 2.8 /100 | #238 | Tragic 30.4% |
| Immigrants | Portugal | 2.1 /100 | #239 | Tragic 30.5% |
| Salvadorans | 1.8 /100 | #240 | Tragic 30.6% |
Demographics Similar to Sierra Leoneans by Single Mother Poverty
In terms of single mother poverty, the demographic groups most similar to Sierra Leoneans are Immigrants from Russia (27.4%, a difference of 0.060%), Immigrants from Europe (27.4%, a difference of 0.060%), Macedonian (27.4%, a difference of 0.090%), Immigrants from Belarus (27.4%, a difference of 0.11%), and Lithuanian (27.4%, a difference of 0.12%).
| Demographics | Rating | Rank | Single Mother Poverty |
| Soviet Union | 99.5 /100 | #66 | Exceptional 27.3% |
| Immigrants | Australia | 99.5 /100 | #67 | Exceptional 27.3% |
| Immigrants | Czechoslovakia | 99.5 /100 | #68 | Exceptional 27.4% |
| Lithuanians | 99.4 /100 | #69 | Exceptional 27.4% |
| Immigrants | Belarus | 99.4 /100 | #70 | Exceptional 27.4% |
| Macedonians | 99.4 /100 | #71 | Exceptional 27.4% |
| Immigrants | Russia | 99.4 /100 | #72 | Exceptional 27.4% |
| Sierra Leoneans | 99.3 /100 | #73 | Exceptional 27.4% |
| Immigrants | Europe | 99.3 /100 | #74 | Exceptional 27.4% |
| Immigrants | Sweden | 99.2 /100 | #75 | Exceptional 27.5% |
| Peruvians | 99.2 /100 | #76 | Exceptional 27.5% |
| Immigrants | Peru | 99.2 /100 | #77 | Exceptional 27.5% |
| Immigrants | North Macedonia | 99.2 /100 | #78 | Exceptional 27.5% |
| Immigrants | Italy | 99.1 /100 | #79 | Exceptional 27.5% |
| Taiwanese | 99.1 /100 | #80 | Exceptional 27.5% |