Immigrants from Jamaica vs Scandinavian Single Mother Poverty
COMPARE
Immigrants from Jamaica
Scandinavian
Single Mother Poverty
Single Mother Poverty Comparison
Immigrants from Jamaica
Scandinavians
29.6%
SINGLE MOTHER POVERTY
22.0/ 100
METRIC RATING
197th/ 347
METRIC RANK
28.9%
SINGLE MOTHER POVERTY
66.2/ 100
METRIC RATING
162nd/ 347
METRIC RANK
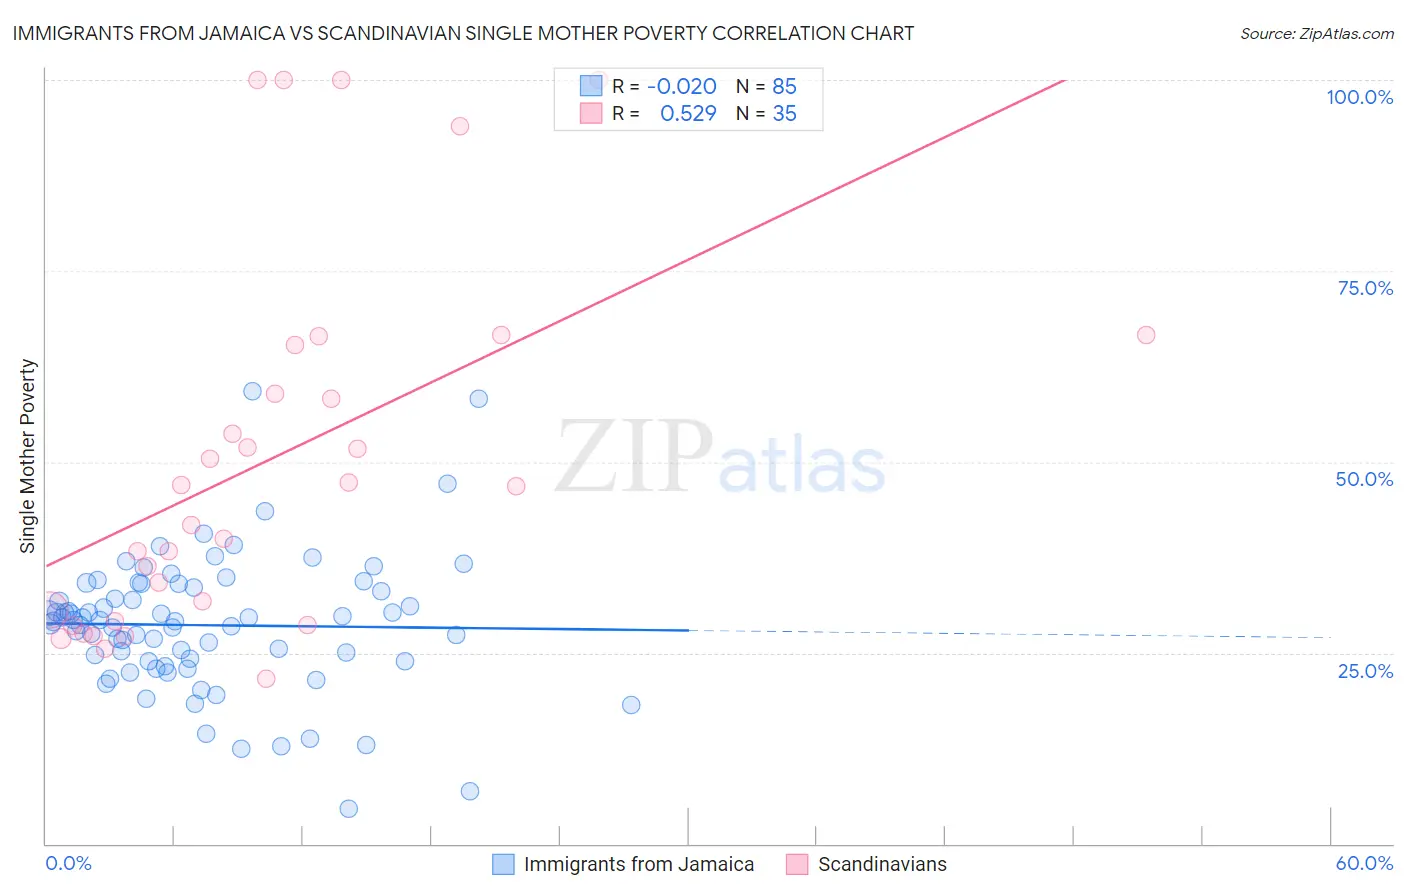
Immigrants from Jamaica vs Scandinavian Single Mother Poverty Correlation Chart
The statistical analysis conducted on geographies consisting of 296,527,600 people shows no correlation between the proportion of Immigrants from Jamaica and poverty level among single mothers in the United States with a correlation coefficient (R) of -0.020 and weighted average of 29.6%. Similarly, the statistical analysis conducted on geographies consisting of 456,235,845 people shows a substantial positive correlation between the proportion of Scandinavians and poverty level among single mothers in the United States with a correlation coefficient (R) of 0.529 and weighted average of 28.9%, a difference of 2.3%.
Single Mother Poverty Correlation Summary
| Measurement | Immigrants from Jamaica | Scandinavian |
| Minimum | 4.6% | 21.6% |
| Maximum | 59.3% | 100.0% |
| Range | 54.7% | 78.4% |
| Mean | 28.6% | 50.2% |
| Median | 29.2% | 46.8% |
| Interquartile 25% (IQ1) | 23.9% | 29.1% |
| Interquartile 75% (IQ3) | 33.8% | 65.3% |
| Interquartile Range (IQR) | 9.9% | 36.2% |
| Standard Deviation (Sample) | 8.9% | 24.0% |
| Standard Deviation (Population) | 8.9% | 23.7% |
Similar Demographics by Single Mother Poverty
Demographics Similar to Immigrants from Jamaica by Single Mother Poverty
In terms of single mother poverty, the demographic groups most similar to Immigrants from Jamaica are Trinidadian and Tobagonian (29.6%, a difference of 0.020%), Cuban (29.6%, a difference of 0.080%), Spanish American Indian (29.6%, a difference of 0.10%), Panamanian (29.6%, a difference of 0.14%), and Slavic (29.6%, a difference of 0.17%).
| Demographics | Rating | Rank | Single Mother Poverty |
| Immigrants | Germany | 30.4 /100 | #190 | Fair 29.5% |
| Immigrants | Trinidad and Tobago | 29.2 /100 | #191 | Fair 29.5% |
| Moroccans | 28.6 /100 | #192 | Fair 29.5% |
| Basques | 28.3 /100 | #193 | Fair 29.5% |
| Icelanders | 26.1 /100 | #194 | Fair 29.5% |
| Slavs | 24.5 /100 | #195 | Fair 29.6% |
| Spanish American Indians | 23.4 /100 | #196 | Fair 29.6% |
| Immigrants | Jamaica | 22.0 /100 | #197 | Fair 29.6% |
| Trinidadians and Tobagonians | 21.7 /100 | #198 | Fair 29.6% |
| Cubans | 20.8 /100 | #199 | Fair 29.6% |
| Panamanians | 20.0 /100 | #200 | Fair 29.6% |
| Belgians | 18.8 /100 | #201 | Poor 29.7% |
| Malaysians | 17.4 /100 | #202 | Poor 29.7% |
| Swiss | 17.2 /100 | #203 | Poor 29.7% |
| Immigrants | Immigrants | 16.6 /100 | #204 | Poor 29.7% |
Demographics Similar to Scandinavians by Single Mother Poverty
In terms of single mother poverty, the demographic groups most similar to Scandinavians are Immigrants from Cambodia (28.9%, a difference of 0.020%), Immigrants from Nigeria (28.9%, a difference of 0.020%), Immigrants from Kenya (28.9%, a difference of 0.020%), Japanese (28.9%, a difference of 0.10%), and Czech (28.9%, a difference of 0.12%).
| Demographics | Rating | Rank | Single Mother Poverty |
| Ugandans | 71.7 /100 | #155 | Good 28.8% |
| Iraqis | 71.5 /100 | #156 | Good 28.8% |
| Immigrants | Western Europe | 71.1 /100 | #157 | Good 28.9% |
| Immigrants | Hungary | 70.6 /100 | #158 | Good 28.9% |
| Czechs | 68.4 /100 | #159 | Good 28.9% |
| Japanese | 68.0 /100 | #160 | Good 28.9% |
| Immigrants | Cambodia | 66.6 /100 | #161 | Good 28.9% |
| Scandinavians | 66.2 /100 | #162 | Good 28.9% |
| Immigrants | Nigeria | 65.9 /100 | #163 | Good 28.9% |
| Immigrants | Kenya | 65.9 /100 | #164 | Good 28.9% |
| Arabs | 60.7 /100 | #165 | Good 29.0% |
| Inupiat | 60.4 /100 | #166 | Good 29.0% |
| Costa Ricans | 58.4 /100 | #167 | Average 29.0% |
| Europeans | 57.6 /100 | #168 | Average 29.1% |
| Immigrants | Uruguay | 57.2 /100 | #169 | Average 29.1% |