Cree vs Immigrants from El Salvador Receiving Food Stamps
COMPARE
Cree
Immigrants from El Salvador
Receiving Food Stamps
Receiving Food Stamps Comparison
Cree
Immigrants from El Salvador
13.7%
RECEIVING FOOD STAMPS
0.8/ 100
METRIC RATING
246th/ 347
METRIC RANK
13.5%
RECEIVING FOOD STAMPS
1.5/ 100
METRIC RATING
237th/ 347
METRIC RANK
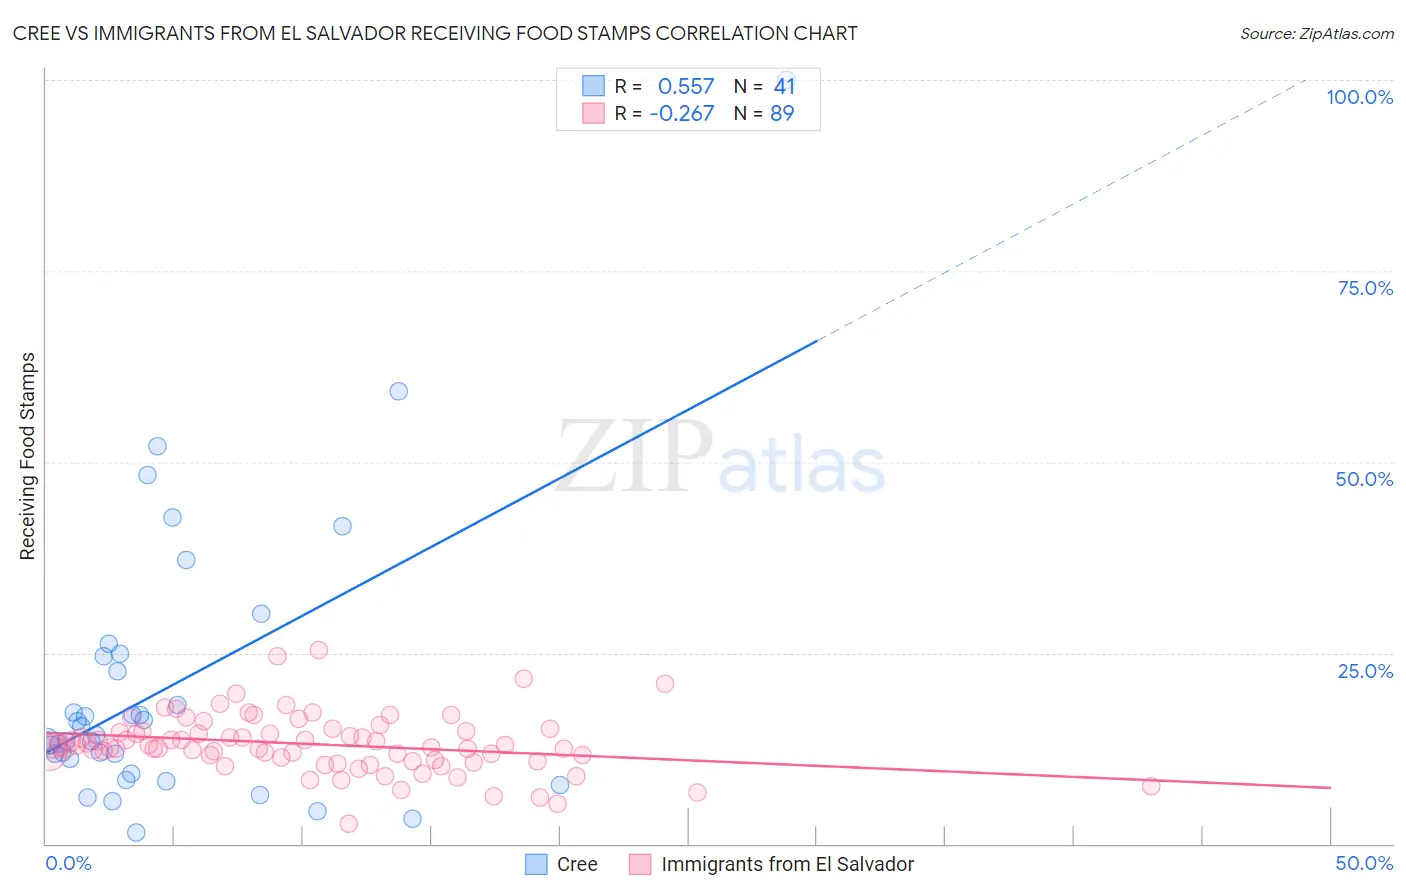
Cree vs Immigrants from El Salvador Receiving Food Stamps Correlation Chart
The statistical analysis conducted on geographies consisting of 76,186,239 people shows a substantial positive correlation between the proportion of Cree and percentage of population receiving government assistance and/or food stamps in the United States with a correlation coefficient (R) of 0.557 and weighted average of 13.7%. Similarly, the statistical analysis conducted on geographies consisting of 357,240,396 people shows a weak negative correlation between the proportion of Immigrants from El Salvador and percentage of population receiving government assistance and/or food stamps in the United States with a correlation coefficient (R) of -0.267 and weighted average of 13.5%, a difference of 2.0%.
Receiving Food Stamps Correlation Summary
| Measurement | Cree | Immigrants from El Salvador |
| Minimum | 1.5% | 2.5% |
| Maximum | 100.0% | 25.4% |
| Range | 98.5% | 22.9% |
| Mean | 20.6% | 13.1% |
| Median | 14.2% | 12.8% |
| Interquartile 25% (IQ1) | 10.1% | 10.9% |
| Interquartile 75% (IQ3) | 24.7% | 14.7% |
| Interquartile Range (IQR) | 14.6% | 3.8% |
| Standard Deviation (Sample) | 18.6% | 3.8% |
| Standard Deviation (Population) | 18.4% | 3.8% |
Demographics Similar to Cree and Immigrants from El Salvador by Receiving Food Stamps
In terms of receiving food stamps, the demographic groups most similar to Cree are Immigrants from Somalia (13.7%, a difference of 0.24%), Mexican American Indian (13.8%, a difference of 0.27%), Cajun (13.7%, a difference of 0.28%), Immigrants from Laos (13.8%, a difference of 0.36%), and Somali (13.7%, a difference of 0.44%). Similarly, the demographic groups most similar to Immigrants from El Salvador are French American Indian (13.5%, a difference of 0.20%), Crow (13.4%, a difference of 0.22%), Immigrants from Micronesia (13.5%, a difference of 0.42%), Immigrants from Zaire (13.4%, a difference of 0.67%), and Iroquois (13.5%, a difference of 0.72%).
| Demographics | Rating | Rank | Receiving Food Stamps |
| Immigrants | Nigeria | 3.4 /100 | #231 | Tragic 13.1% |
| Salvadorans | 2.7 /100 | #232 | Tragic 13.2% |
| Cherokee | 2.5 /100 | #233 | Tragic 13.2% |
| Comanche | 2.4 /100 | #234 | Tragic 13.3% |
| Immigrants | Zaire | 1.9 /100 | #235 | Tragic 13.4% |
| Crow | 1.6 /100 | #236 | Tragic 13.4% |
| Immigrants | El Salvador | 1.5 /100 | #237 | Tragic 13.5% |
| French American Indians | 1.4 /100 | #238 | Tragic 13.5% |
| Immigrants | Micronesia | 1.3 /100 | #239 | Tragic 13.5% |
| Iroquois | 1.2 /100 | #240 | Tragic 13.5% |
| Choctaw | 1.0 /100 | #241 | Tragic 13.6% |
| Immigrants | Panama | 1.0 /100 | #242 | Tragic 13.6% |
| Somalis | 0.9 /100 | #243 | Tragic 13.7% |
| Cajuns | 0.9 /100 | #244 | Tragic 13.7% |
| Immigrants | Somalia | 0.9 /100 | #245 | Tragic 13.7% |
| Cree | 0.8 /100 | #246 | Tragic 13.7% |
| Mexican American Indians | 0.7 /100 | #247 | Tragic 13.8% |
| Immigrants | Laos | 0.7 /100 | #248 | Tragic 13.8% |
| Indonesians | 0.6 /100 | #249 | Tragic 13.9% |
| Immigrants | Cambodia | 0.5 /100 | #250 | Tragic 13.9% |
| Yaqui | 0.5 /100 | #251 | Tragic 13.9% |