Cree vs Immigrants from Romania Single Father Poverty
COMPARE
Cree
Immigrants from Romania
Single Father Poverty
Single Father Poverty Comparison
Cree
Immigrants from Romania
17.1%
SINGLE FATHER POVERTY
1.0/ 100
METRIC RATING
253rd/ 347
METRIC RANK
15.5%
SINGLE FATHER POVERTY
98.6/ 100
METRIC RATING
91st/ 347
METRIC RANK
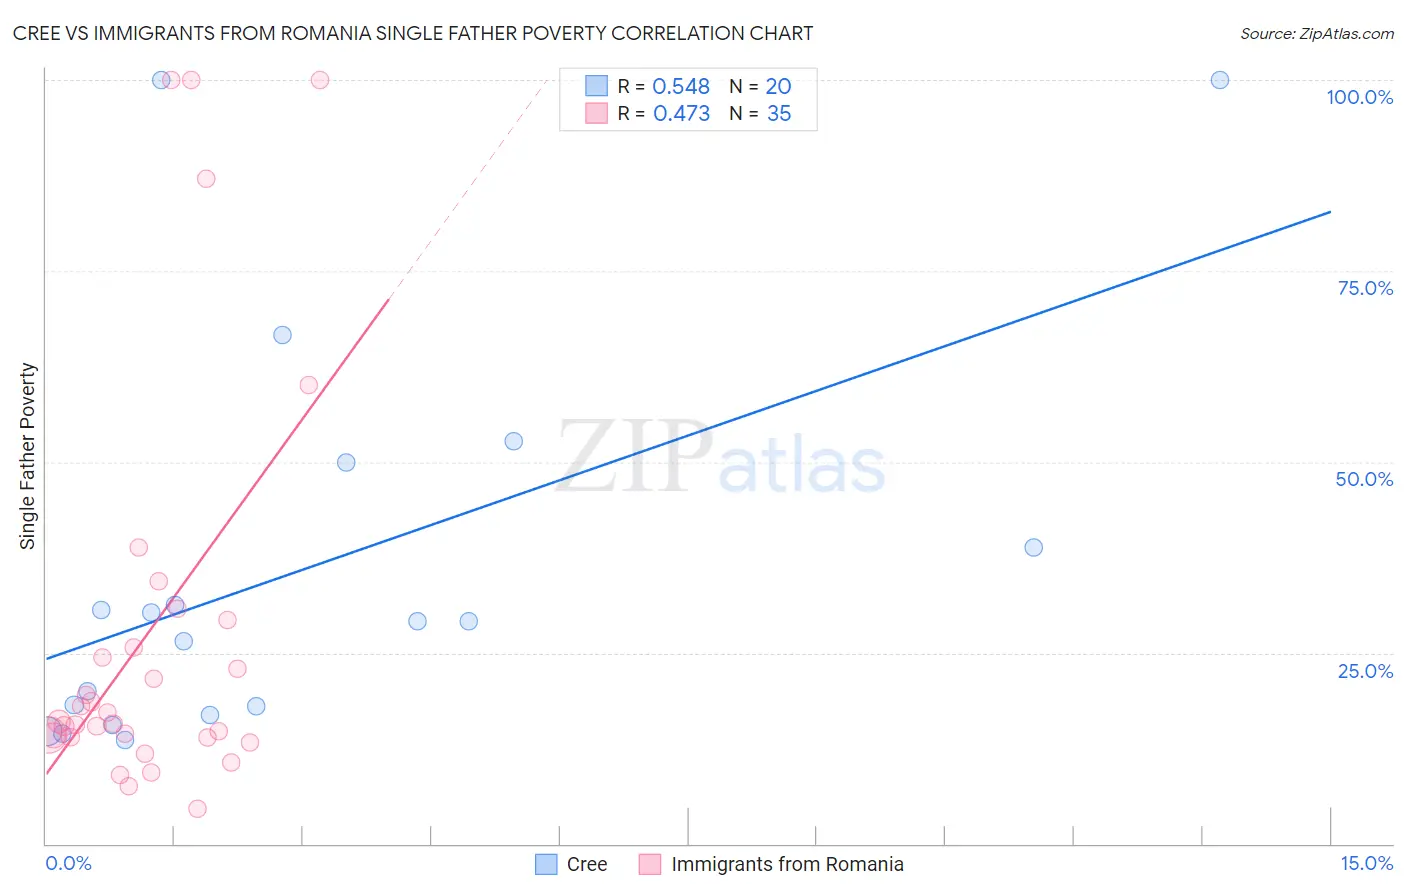
Cree vs Immigrants from Romania Single Father Poverty Correlation Chart
The statistical analysis conducted on geographies consisting of 70,905,004 people shows a substantial positive correlation between the proportion of Cree and poverty level among single fathers in the United States with a correlation coefficient (R) of 0.548 and weighted average of 17.1%. Similarly, the statistical analysis conducted on geographies consisting of 209,903,487 people shows a moderate positive correlation between the proportion of Immigrants from Romania and poverty level among single fathers in the United States with a correlation coefficient (R) of 0.473 and weighted average of 15.5%, a difference of 10.3%.
Single Father Poverty Correlation Summary
| Measurement | Cree | Immigrants from Romania |
| Minimum | 13.5% | 4.5% |
| Maximum | 100.0% | 100.0% |
| Range | 86.5% | 95.5% |
| Mean | 35.8% | 27.9% |
| Median | 29.2% | 16.0% |
| Interquartile 25% (IQ1) | 17.4% | 13.9% |
| Interquartile 75% (IQ3) | 44.4% | 29.3% |
| Interquartile Range (IQR) | 26.9% | 15.3% |
| Standard Deviation (Sample) | 26.1% | 27.1% |
| Standard Deviation (Population) | 25.5% | 26.8% |
Similar Demographics by Single Father Poverty
Demographics Similar to Cree by Single Father Poverty
In terms of single father poverty, the demographic groups most similar to Cree are Croatian (17.1%, a difference of 0.010%), Austrian (17.1%, a difference of 0.11%), Luxembourger (17.1%, a difference of 0.11%), Immigrants from Honduras (17.1%, a difference of 0.12%), and Canadian (17.1%, a difference of 0.25%).
| Demographics | Rating | Rank | Single Father Poverty |
| Immigrants | Ireland | 1.4 /100 | #246 | Tragic 17.1% |
| Greeks | 1.3 /100 | #247 | Tragic 17.1% |
| Czechoslovakians | 1.3 /100 | #248 | Tragic 17.1% |
| Canadians | 1.3 /100 | #249 | Tragic 17.1% |
| Austrians | 1.1 /100 | #250 | Tragic 17.1% |
| Luxembourgers | 1.1 /100 | #251 | Tragic 17.1% |
| Croatians | 1.0 /100 | #252 | Tragic 17.1% |
| Cree | 1.0 /100 | #253 | Tragic 17.1% |
| Immigrants | Honduras | 0.9 /100 | #254 | Tragic 17.1% |
| Sierra Leoneans | 0.8 /100 | #255 | Tragic 17.2% |
| Immigrants | Haiti | 0.8 /100 | #256 | Tragic 17.2% |
| Immigrants | Albania | 0.7 /100 | #257 | Tragic 17.2% |
| Albanians | 0.7 /100 | #258 | Tragic 17.2% |
| Immigrants | Jamaica | 0.7 /100 | #259 | Tragic 17.2% |
| Spaniards | 0.6 /100 | #260 | Tragic 17.2% |
Demographics Similar to Immigrants from Romania by Single Father Poverty
In terms of single father poverty, the demographic groups most similar to Immigrants from Romania are Mexican American Indian (15.5%, a difference of 0.10%), Immigrants from Serbia (15.5%, a difference of 0.11%), Basque (15.5%, a difference of 0.15%), Immigrants from Uruguay (15.6%, a difference of 0.29%), and Immigrants from Korea (15.5%, a difference of 0.34%).
| Demographics | Rating | Rank | Single Father Poverty |
| Peruvians | 99.2 /100 | #84 | Exceptional 15.4% |
| Immigrants | Oceania | 99.1 /100 | #85 | Exceptional 15.4% |
| Immigrants | Russia | 99.0 /100 | #86 | Exceptional 15.5% |
| Brazilians | 99.0 /100 | #87 | Exceptional 15.5% |
| Burmese | 99.0 /100 | #88 | Exceptional 15.5% |
| Immigrants | Korea | 99.0 /100 | #89 | Exceptional 15.5% |
| Mexican American Indians | 98.7 /100 | #90 | Exceptional 15.5% |
| Immigrants | Romania | 98.6 /100 | #91 | Exceptional 15.5% |
| Immigrants | Serbia | 98.5 /100 | #92 | Exceptional 15.5% |
| Basques | 98.4 /100 | #93 | Exceptional 15.5% |
| Immigrants | Uruguay | 98.2 /100 | #94 | Exceptional 15.6% |
| Immigrants | Kazakhstan | 98.2 /100 | #95 | Exceptional 15.6% |
| Immigrants | Belgium | 98.1 /100 | #96 | Exceptional 15.6% |
| Yaqui | 98.1 /100 | #97 | Exceptional 15.6% |
| Zimbabweans | 98.1 /100 | #98 | Exceptional 15.6% |