Cree vs Romanian Single Father Poverty
COMPARE
Cree
Romanian
Single Father Poverty
Single Father Poverty Comparison
Cree
Romanians
17.1%
SINGLE FATHER POVERTY
1.0/ 100
METRIC RATING
253rd/ 347
METRIC RANK
16.5%
SINGLE FATHER POVERTY
20.1/ 100
METRIC RATING
198th/ 347
METRIC RANK
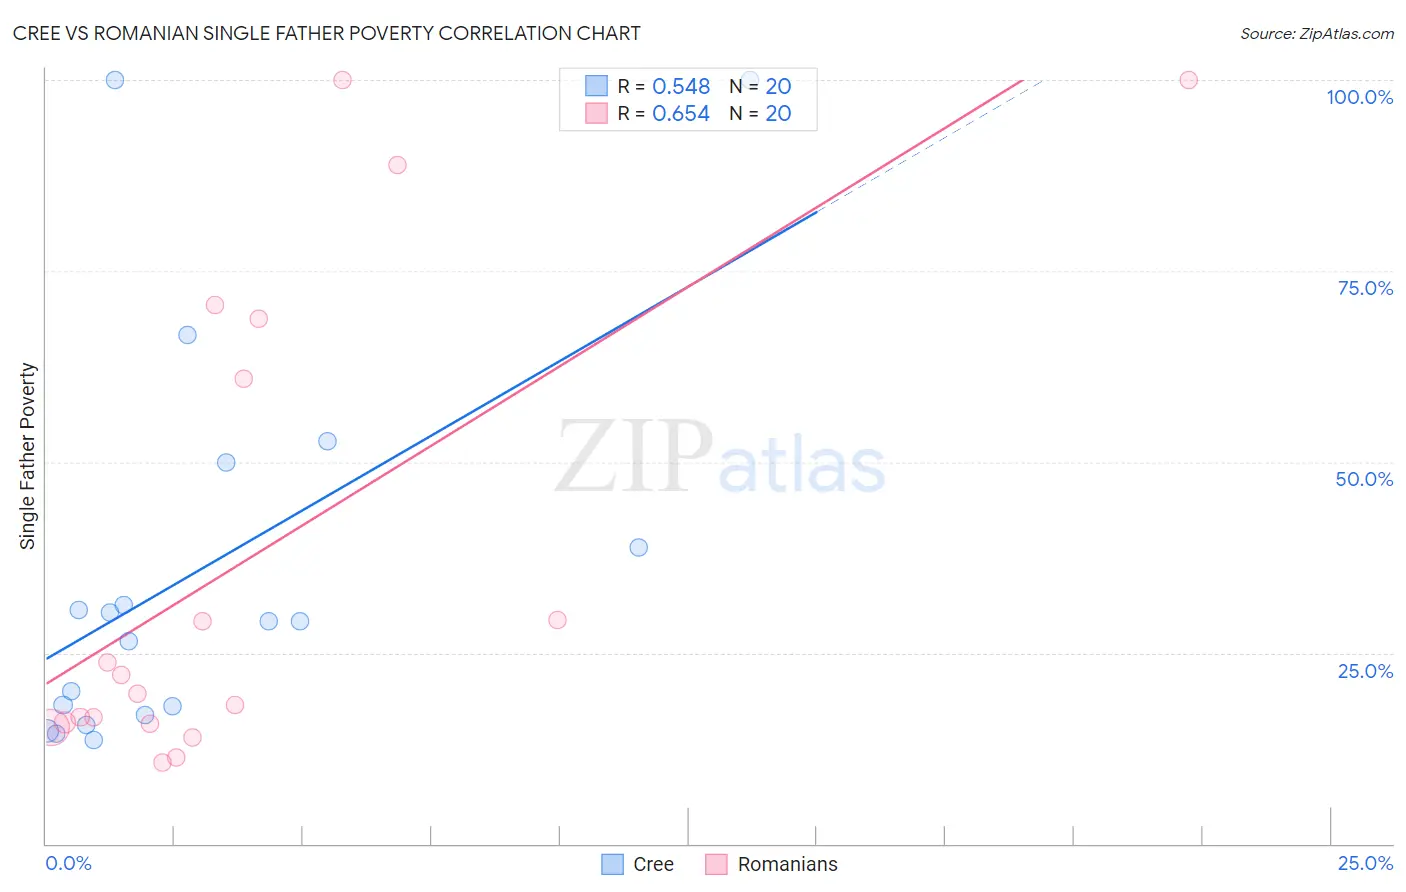
Cree vs Romanian Single Father Poverty Correlation Chart
The statistical analysis conducted on geographies consisting of 70,905,004 people shows a substantial positive correlation between the proportion of Cree and poverty level among single fathers in the United States with a correlation coefficient (R) of 0.548 and weighted average of 17.1%. Similarly, the statistical analysis conducted on geographies consisting of 293,248,867 people shows a significant positive correlation between the proportion of Romanians and poverty level among single fathers in the United States with a correlation coefficient (R) of 0.654 and weighted average of 16.5%, a difference of 3.5%.
Single Father Poverty Correlation Summary
| Measurement | Cree | Romanian |
| Minimum | 13.5% | 10.6% |
| Maximum | 100.0% | 100.0% |
| Range | 86.5% | 89.4% |
| Mean | 35.8% | 37.3% |
| Median | 29.2% | 20.9% |
| Interquartile 25% (IQ1) | 17.4% | 15.8% |
| Interquartile 75% (IQ3) | 44.4% | 64.8% |
| Interquartile Range (IQR) | 26.9% | 49.0% |
| Standard Deviation (Sample) | 26.1% | 31.3% |
| Standard Deviation (Population) | 25.5% | 30.5% |
Similar Demographics by Single Father Poverty
Demographics Similar to Cree by Single Father Poverty
In terms of single father poverty, the demographic groups most similar to Cree are Croatian (17.1%, a difference of 0.010%), Austrian (17.1%, a difference of 0.11%), Luxembourger (17.1%, a difference of 0.11%), Immigrants from Honduras (17.1%, a difference of 0.12%), and Canadian (17.1%, a difference of 0.25%).
| Demographics | Rating | Rank | Single Father Poverty |
| Immigrants | Ireland | 1.4 /100 | #246 | Tragic 17.1% |
| Greeks | 1.3 /100 | #247 | Tragic 17.1% |
| Czechoslovakians | 1.3 /100 | #248 | Tragic 17.1% |
| Canadians | 1.3 /100 | #249 | Tragic 17.1% |
| Austrians | 1.1 /100 | #250 | Tragic 17.1% |
| Luxembourgers | 1.1 /100 | #251 | Tragic 17.1% |
| Croatians | 1.0 /100 | #252 | Tragic 17.1% |
| Cree | 1.0 /100 | #253 | Tragic 17.1% |
| Immigrants | Honduras | 0.9 /100 | #254 | Tragic 17.1% |
| Sierra Leoneans | 0.8 /100 | #255 | Tragic 17.2% |
| Immigrants | Haiti | 0.8 /100 | #256 | Tragic 17.2% |
| Immigrants | Albania | 0.7 /100 | #257 | Tragic 17.2% |
| Albanians | 0.7 /100 | #258 | Tragic 17.2% |
| Immigrants | Jamaica | 0.7 /100 | #259 | Tragic 17.2% |
| Spaniards | 0.6 /100 | #260 | Tragic 17.2% |
Demographics Similar to Romanians by Single Father Poverty
In terms of single father poverty, the demographic groups most similar to Romanians are Immigrants from Northern Europe (16.5%, a difference of 0.010%), Immigrants from Belize (16.5%, a difference of 0.020%), Immigrants from Canada (16.5%, a difference of 0.12%), Syrian (16.6%, a difference of 0.19%), and Cuban (16.6%, a difference of 0.26%).
| Demographics | Rating | Rank | Single Father Poverty |
| Immigrants | Guyana | 27.1 /100 | #191 | Fair 16.5% |
| Immigrants | Switzerland | 24.8 /100 | #192 | Fair 16.5% |
| Ecuadorians | 24.5 /100 | #193 | Fair 16.5% |
| Cape Verdeans | 24.4 /100 | #194 | Fair 16.5% |
| Immigrants | Barbados | 24.3 /100 | #195 | Fair 16.5% |
| Immigrants | Canada | 21.9 /100 | #196 | Fair 16.5% |
| Immigrants | Northern Europe | 20.3 /100 | #197 | Fair 16.5% |
| Romanians | 20.1 /100 | #198 | Fair 16.5% |
| Immigrants | Belize | 19.8 /100 | #199 | Poor 16.5% |
| Syrians | 17.4 /100 | #200 | Poor 16.6% |
| Cubans | 16.5 /100 | #201 | Poor 16.6% |
| Immigrants | Croatia | 16.5 /100 | #202 | Poor 16.6% |
| Immigrants | North America | 15.1 /100 | #203 | Poor 16.6% |
| Immigrants | Guatemala | 14.8 /100 | #204 | Poor 16.6% |
| Venezuelans | 14.3 /100 | #205 | Poor 16.6% |