Cree vs Norwegian Single Father Poverty
COMPARE
Cree
Norwegian
Single Father Poverty
Single Father Poverty Comparison
Cree
Norwegians
17.1%
SINGLE FATHER POVERTY
1.0/ 100
METRIC RATING
253rd/ 347
METRIC RANK
15.9%
SINGLE FATHER POVERTY
90.2/ 100
METRIC RATING
130th/ 347
METRIC RANK
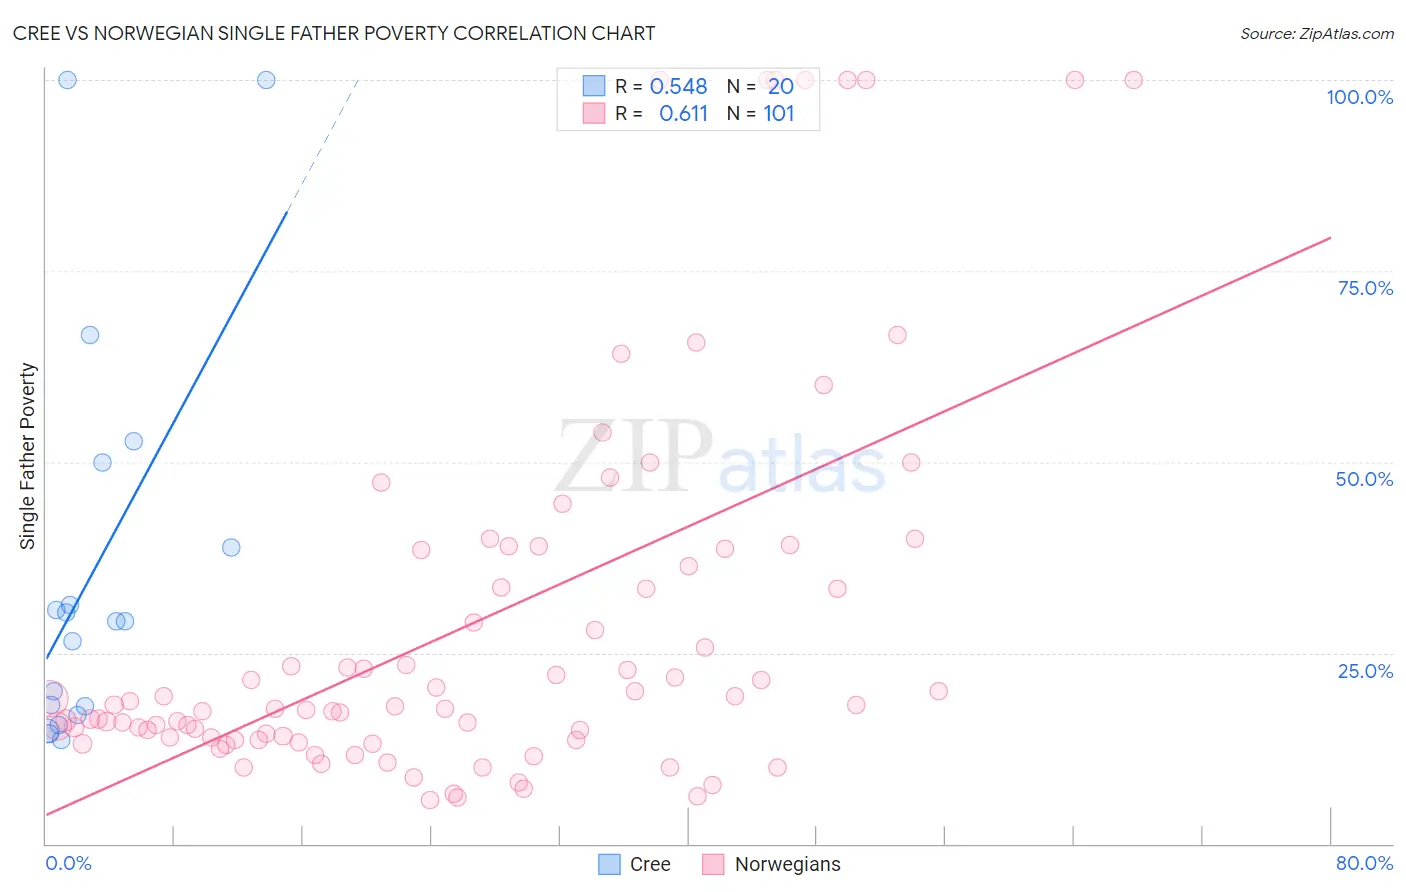
Cree vs Norwegian Single Father Poverty Correlation Chart
The statistical analysis conducted on geographies consisting of 70,905,004 people shows a substantial positive correlation between the proportion of Cree and poverty level among single fathers in the United States with a correlation coefficient (R) of 0.548 and weighted average of 17.1%. Similarly, the statistical analysis conducted on geographies consisting of 388,337,291 people shows a significant positive correlation between the proportion of Norwegians and poverty level among single fathers in the United States with a correlation coefficient (R) of 0.611 and weighted average of 15.9%, a difference of 7.7%.
Single Father Poverty Correlation Summary
| Measurement | Cree | Norwegian |
| Minimum | 13.5% | 5.8% |
| Maximum | 100.0% | 100.0% |
| Range | 86.5% | 94.2% |
| Mean | 35.8% | 28.6% |
| Median | 29.2% | 17.9% |
| Interquartile 25% (IQ1) | 17.4% | 13.8% |
| Interquartile 75% (IQ3) | 44.4% | 37.4% |
| Interquartile Range (IQR) | 26.9% | 23.6% |
| Standard Deviation (Sample) | 26.1% | 25.1% |
| Standard Deviation (Population) | 25.5% | 25.0% |
Similar Demographics by Single Father Poverty
Demographics Similar to Cree by Single Father Poverty
In terms of single father poverty, the demographic groups most similar to Cree are Croatian (17.1%, a difference of 0.010%), Austrian (17.1%, a difference of 0.11%), Luxembourger (17.1%, a difference of 0.11%), Immigrants from Honduras (17.1%, a difference of 0.12%), and Canadian (17.1%, a difference of 0.25%).
| Demographics | Rating | Rank | Single Father Poverty |
| Immigrants | Ireland | 1.4 /100 | #246 | Tragic 17.1% |
| Greeks | 1.3 /100 | #247 | Tragic 17.1% |
| Czechoslovakians | 1.3 /100 | #248 | Tragic 17.1% |
| Canadians | 1.3 /100 | #249 | Tragic 17.1% |
| Austrians | 1.1 /100 | #250 | Tragic 17.1% |
| Luxembourgers | 1.1 /100 | #251 | Tragic 17.1% |
| Croatians | 1.0 /100 | #252 | Tragic 17.1% |
| Cree | 1.0 /100 | #253 | Tragic 17.1% |
| Immigrants | Honduras | 0.9 /100 | #254 | Tragic 17.1% |
| Sierra Leoneans | 0.8 /100 | #255 | Tragic 17.2% |
| Immigrants | Haiti | 0.8 /100 | #256 | Tragic 17.2% |
| Immigrants | Albania | 0.7 /100 | #257 | Tragic 17.2% |
| Albanians | 0.7 /100 | #258 | Tragic 17.2% |
| Immigrants | Jamaica | 0.7 /100 | #259 | Tragic 17.2% |
| Spaniards | 0.6 /100 | #260 | Tragic 17.2% |
Demographics Similar to Norwegians by Single Father Poverty
In terms of single father poverty, the demographic groups most similar to Norwegians are Nicaraguan (15.9%, a difference of 0.0%), Immigrants from Portugal (15.9%, a difference of 0.060%), Immigrants from Nigeria (15.9%, a difference of 0.080%), Immigrants from West Indies (15.9%, a difference of 0.080%), and Immigrants from Syria (15.9%, a difference of 0.080%).
| Demographics | Rating | Rank | Single Father Poverty |
| Palestinians | 91.3 /100 | #123 | Exceptional 15.9% |
| Immigrants | Panama | 91.3 /100 | #124 | Exceptional 15.9% |
| Iraqis | 91.2 /100 | #125 | Exceptional 15.9% |
| Hmong | 91.1 /100 | #126 | Exceptional 15.9% |
| Immigrants | Liberia | 91.1 /100 | #127 | Exceptional 15.9% |
| Immigrants | Nigeria | 90.8 /100 | #128 | Exceptional 15.9% |
| Immigrants | West Indies | 90.8 /100 | #129 | Exceptional 15.9% |
| Norwegians | 90.2 /100 | #130 | Exceptional 15.9% |
| Nicaraguans | 90.1 /100 | #131 | Exceptional 15.9% |
| Immigrants | Portugal | 89.7 /100 | #132 | Excellent 15.9% |
| Immigrants | Syria | 89.5 /100 | #133 | Excellent 15.9% |
| Immigrants | South America | 88.5 /100 | #134 | Excellent 15.9% |
| Immigrants | Sri Lanka | 88.2 /100 | #135 | Excellent 15.9% |
| Cypriots | 87.5 /100 | #136 | Excellent 15.9% |
| Immigrants | Azores | 87.2 /100 | #137 | Excellent 15.9% |