Cree vs Immigrants from Denmark Single Father Poverty
COMPARE
Cree
Immigrants from Denmark
Single Father Poverty
Single Father Poverty Comparison
Cree
Immigrants from Denmark
17.1%
SINGLE FATHER POVERTY
1.0/ 100
METRIC RATING
253rd/ 347
METRIC RANK
16.7%
SINGLE FATHER POVERTY
8.1/ 100
METRIC RATING
220th/ 347
METRIC RANK
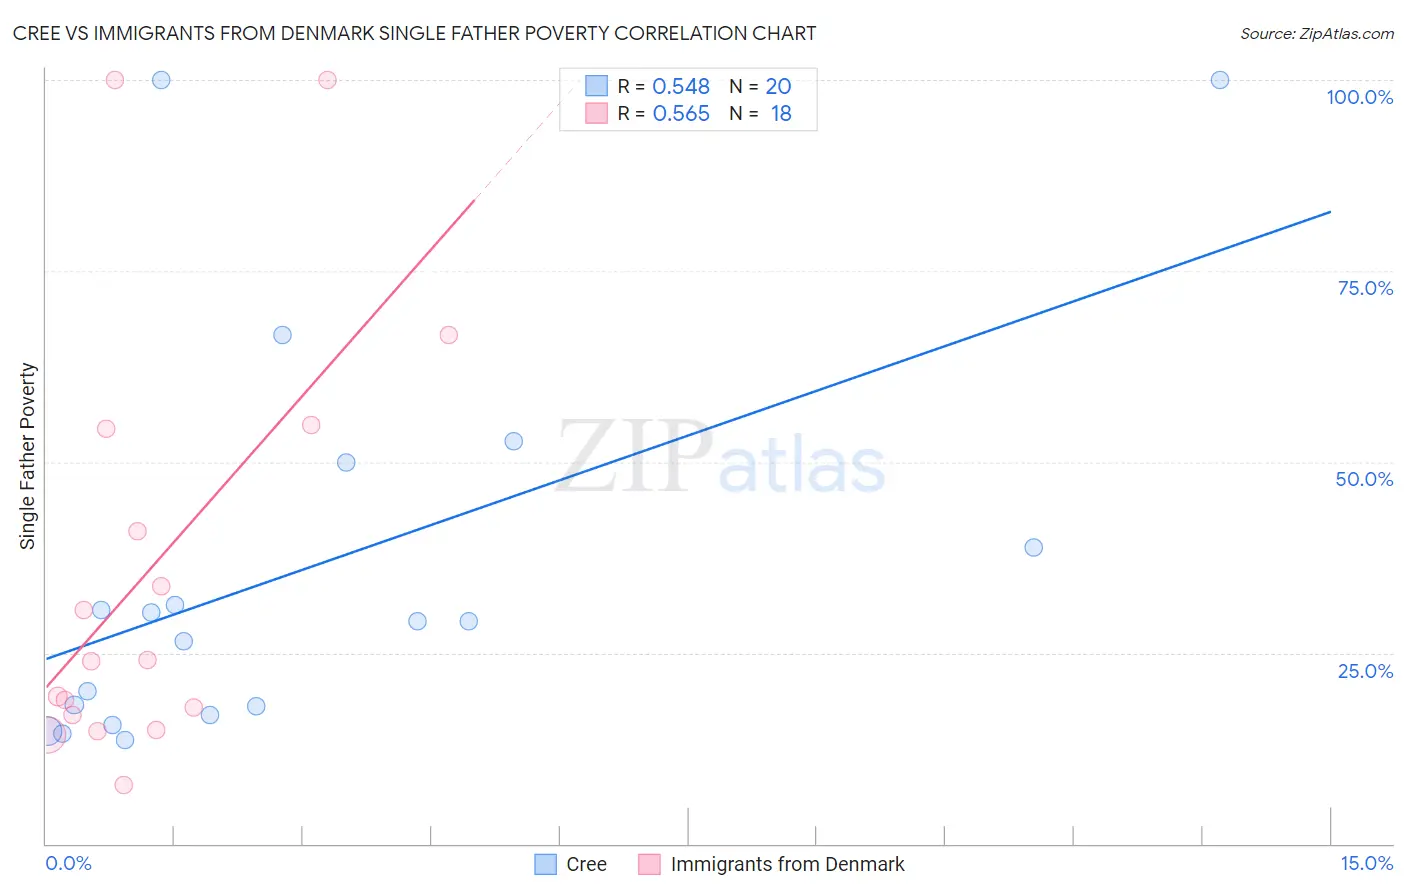
Cree vs Immigrants from Denmark Single Father Poverty Correlation Chart
The statistical analysis conducted on geographies consisting of 70,905,004 people shows a substantial positive correlation between the proportion of Cree and poverty level among single fathers in the United States with a correlation coefficient (R) of 0.548 and weighted average of 17.1%. Similarly, the statistical analysis conducted on geographies consisting of 116,977,797 people shows a substantial positive correlation between the proportion of Immigrants from Denmark and poverty level among single fathers in the United States with a correlation coefficient (R) of 0.565 and weighted average of 16.7%, a difference of 2.3%.
Single Father Poverty Correlation Summary
| Measurement | Cree | Immigrants from Denmark |
| Minimum | 13.5% | 7.7% |
| Maximum | 100.0% | 100.0% |
| Range | 86.5% | 92.3% |
| Mean | 35.8% | 36.3% |
| Median | 29.2% | 24.0% |
| Interquartile 25% (IQ1) | 17.4% | 16.9% |
| Interquartile 75% (IQ3) | 44.4% | 54.3% |
| Interquartile Range (IQR) | 26.9% | 37.4% |
| Standard Deviation (Sample) | 26.1% | 28.3% |
| Standard Deviation (Population) | 25.5% | 27.5% |
Similar Demographics by Single Father Poverty
Demographics Similar to Cree by Single Father Poverty
In terms of single father poverty, the demographic groups most similar to Cree are Croatian (17.1%, a difference of 0.010%), Austrian (17.1%, a difference of 0.11%), Luxembourger (17.1%, a difference of 0.11%), Immigrants from Honduras (17.1%, a difference of 0.12%), and Canadian (17.1%, a difference of 0.25%).
| Demographics | Rating | Rank | Single Father Poverty |
| Immigrants | Ireland | 1.4 /100 | #246 | Tragic 17.1% |
| Greeks | 1.3 /100 | #247 | Tragic 17.1% |
| Czechoslovakians | 1.3 /100 | #248 | Tragic 17.1% |
| Canadians | 1.3 /100 | #249 | Tragic 17.1% |
| Austrians | 1.1 /100 | #250 | Tragic 17.1% |
| Luxembourgers | 1.1 /100 | #251 | Tragic 17.1% |
| Croatians | 1.0 /100 | #252 | Tragic 17.1% |
| Cree | 1.0 /100 | #253 | Tragic 17.1% |
| Immigrants | Honduras | 0.9 /100 | #254 | Tragic 17.1% |
| Sierra Leoneans | 0.8 /100 | #255 | Tragic 17.2% |
| Immigrants | Haiti | 0.8 /100 | #256 | Tragic 17.2% |
| Immigrants | Albania | 0.7 /100 | #257 | Tragic 17.2% |
| Albanians | 0.7 /100 | #258 | Tragic 17.2% |
| Immigrants | Jamaica | 0.7 /100 | #259 | Tragic 17.2% |
| Spaniards | 0.6 /100 | #260 | Tragic 17.2% |
Demographics Similar to Immigrants from Denmark by Single Father Poverty
In terms of single father poverty, the demographic groups most similar to Immigrants from Denmark are Immigrants from Greece (16.7%, a difference of 0.0%), Immigrants from Ghana (16.7%, a difference of 0.010%), Immigrants from Spain (16.7%, a difference of 0.010%), Immigrants from Uganda (16.7%, a difference of 0.070%), and Cheyenne (16.7%, a difference of 0.17%).
| Demographics | Rating | Rank | Single Father Poverty |
| Ghanaians | 11.0 /100 | #213 | Poor 16.7% |
| Spanish | 10.7 /100 | #214 | Poor 16.7% |
| Immigrants | Scotland | 9.6 /100 | #215 | Tragic 16.7% |
| Immigrants | England | 9.5 /100 | #216 | Tragic 16.7% |
| Cheyenne | 9.3 /100 | #217 | Tragic 16.7% |
| Immigrants | Uganda | 8.6 /100 | #218 | Tragic 16.7% |
| Immigrants | Ghana | 8.1 /100 | #219 | Tragic 16.7% |
| Immigrants | Denmark | 8.1 /100 | #220 | Tragic 16.7% |
| Immigrants | Greece | 8.1 /100 | #221 | Tragic 16.7% |
| Immigrants | Spain | 8.0 /100 | #222 | Tragic 16.7% |
| Immigrants | Austria | 7.0 /100 | #223 | Tragic 16.8% |
| Immigrants | Norway | 6.5 /100 | #224 | Tragic 16.8% |
| Menominee | 6.4 /100 | #225 | Tragic 16.8% |
| Hispanics or Latinos | 6.1 /100 | #226 | Tragic 16.8% |
| British | 5.6 /100 | #227 | Tragic 16.8% |