Immigrants from Jordan vs Immigrants from Albania Single Mother Poverty
COMPARE
Immigrants from Jordan
Immigrants from Albania
Single Mother Poverty
Single Mother Poverty Comparison
Immigrants from Jordan
Immigrants from Albania
27.1%
SINGLE MOTHER POVERTY
99.7/ 100
METRIC RATING
53rd/ 347
METRIC RANK
27.8%
SINGLE MOTHER POVERTY
98.0/ 100
METRIC RATING
91st/ 347
METRIC RANK
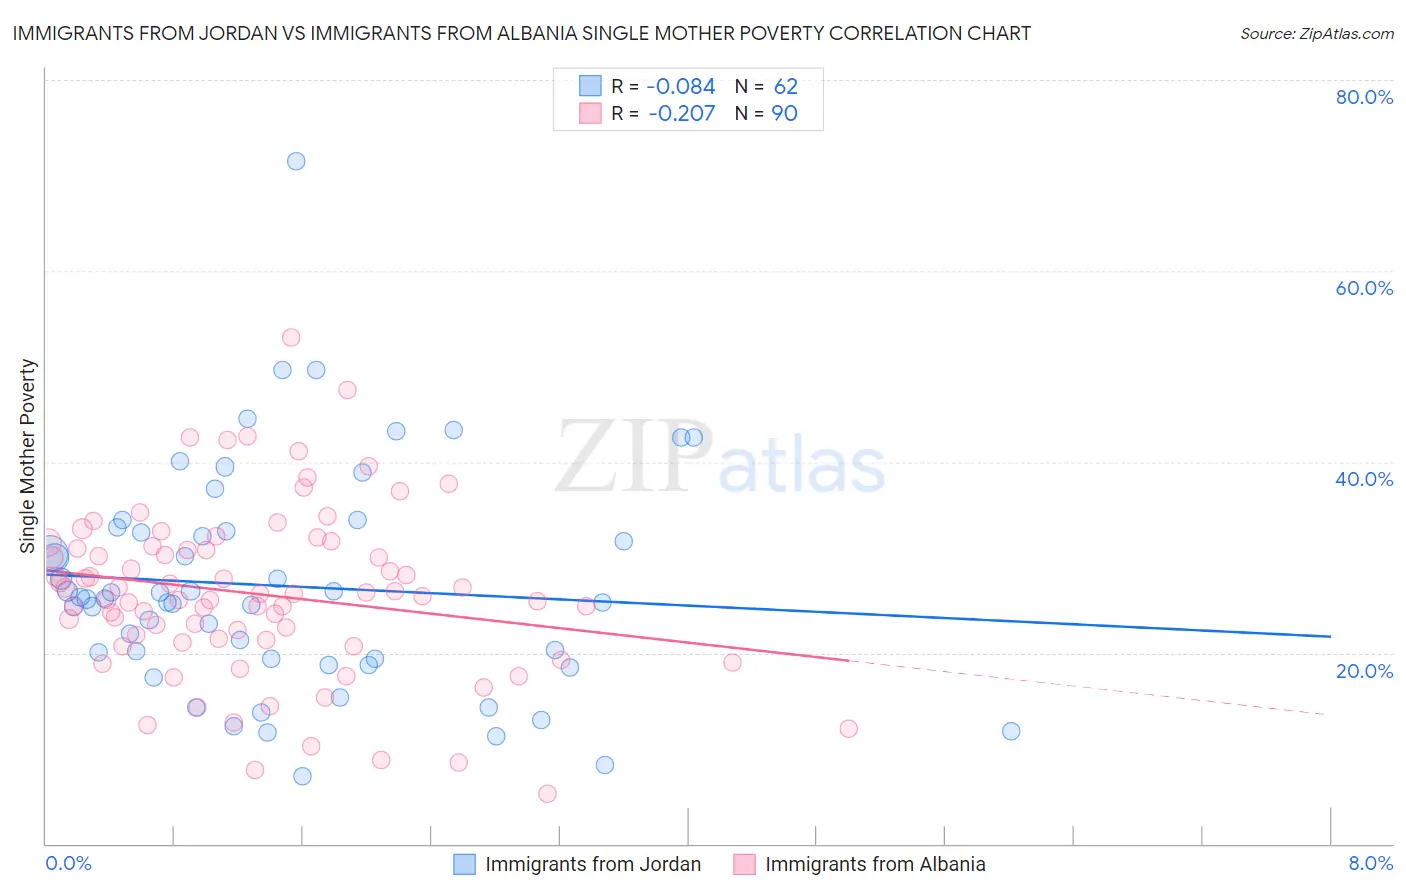
Immigrants from Jordan vs Immigrants from Albania Single Mother Poverty Correlation Chart
The statistical analysis conducted on geographies consisting of 179,287,213 people shows a slight negative correlation between the proportion of Immigrants from Jordan and poverty level among single mothers in the United States with a correlation coefficient (R) of -0.084 and weighted average of 27.1%. Similarly, the statistical analysis conducted on geographies consisting of 117,790,749 people shows a weak negative correlation between the proportion of Immigrants from Albania and poverty level among single mothers in the United States with a correlation coefficient (R) of -0.207 and weighted average of 27.8%, a difference of 2.5%.
Single Mother Poverty Correlation Summary
| Measurement | Immigrants from Jordan | Immigrants from Albania |
| Minimum | 7.0% | 5.2% |
| Maximum | 71.6% | 53.0% |
| Range | 64.5% | 47.8% |
| Mean | 27.0% | 26.1% |
| Median | 25.6% | 26.0% |
| Interquartile 25% (IQ1) | 19.4% | 21.3% |
| Interquartile 75% (IQ3) | 32.7% | 31.0% |
| Interquartile Range (IQR) | 13.3% | 9.7% |
| Standard Deviation (Sample) | 11.7% | 8.8% |
| Standard Deviation (Population) | 11.6% | 8.8% |
Similar Demographics by Single Mother Poverty
Demographics Similar to Immigrants from Jordan by Single Mother Poverty
In terms of single mother poverty, the demographic groups most similar to Immigrants from Jordan are Immigrants from Bulgaria (27.1%, a difference of 0.030%), Immigrants from South Eastern Asia (27.1%, a difference of 0.040%), Immigrants from Egypt (27.1%, a difference of 0.060%), Immigrants from Argentina (27.1%, a difference of 0.080%), and Immigrants from Romania (27.2%, a difference of 0.11%).
| Demographics | Rating | Rank | Single Mother Poverty |
| Immigrants | Serbia | 99.9 /100 | #46 | Exceptional 26.9% |
| Egyptians | 99.8 /100 | #47 | Exceptional 26.9% |
| Immigrants | Poland | 99.8 /100 | #48 | Exceptional 26.9% |
| Cambodians | 99.8 /100 | #49 | Exceptional 27.0% |
| Laotians | 99.8 /100 | #50 | Exceptional 27.0% |
| Immigrants | Argentina | 99.7 /100 | #51 | Exceptional 27.1% |
| Immigrants | South Eastern Asia | 99.7 /100 | #52 | Exceptional 27.1% |
| Immigrants | Jordan | 99.7 /100 | #53 | Exceptional 27.1% |
| Immigrants | Bulgaria | 99.7 /100 | #54 | Exceptional 27.1% |
| Immigrants | Egypt | 99.7 /100 | #55 | Exceptional 27.1% |
| Immigrants | Romania | 99.7 /100 | #56 | Exceptional 27.2% |
| Palestinians | 99.7 /100 | #57 | Exceptional 27.2% |
| Argentineans | 99.6 /100 | #58 | Exceptional 27.2% |
| Paraguayans | 99.6 /100 | #59 | Exceptional 27.2% |
| Eastern Europeans | 99.6 /100 | #60 | Exceptional 27.2% |
Demographics Similar to Immigrants from Albania by Single Mother Poverty
In terms of single mother poverty, the demographic groups most similar to Immigrants from Albania are Estonian (27.8%, a difference of 0.030%), Romanian (27.8%, a difference of 0.12%), Immigrants from France (27.8%, a difference of 0.14%), Albanian (27.9%, a difference of 0.22%), and Chilean (27.9%, a difference of 0.25%).
| Demographics | Rating | Rank | Single Mother Poverty |
| Immigrants | Latvia | 98.7 /100 | #84 | Exceptional 27.7% |
| Mongolians | 98.7 /100 | #85 | Exceptional 27.7% |
| Immigrants | Ukraine | 98.6 /100 | #86 | Exceptional 27.7% |
| Afghans | 98.5 /100 | #87 | Exceptional 27.7% |
| Ethiopians | 98.4 /100 | #88 | Exceptional 27.7% |
| Immigrants | Ethiopia | 98.4 /100 | #89 | Exceptional 27.7% |
| Immigrants | France | 98.2 /100 | #90 | Exceptional 27.8% |
| Immigrants | Albania | 98.0 /100 | #91 | Exceptional 27.8% |
| Estonians | 97.9 /100 | #92 | Exceptional 27.8% |
| Romanians | 97.8 /100 | #93 | Exceptional 27.8% |
| Albanians | 97.6 /100 | #94 | Exceptional 27.9% |
| Chileans | 97.5 /100 | #95 | Exceptional 27.9% |
| Immigrants | Iraq | 97.3 /100 | #96 | Exceptional 27.9% |
| Immigrants | Brazil | 97.2 /100 | #97 | Exceptional 27.9% |
| Immigrants | Nepal | 97.2 /100 | #98 | Exceptional 27.9% |