Chickasaw vs Immigrants from Albania Single Mother Poverty
COMPARE
Chickasaw
Immigrants from Albania
Single Mother Poverty
Single Mother Poverty Comparison
Chickasaw
Immigrants from Albania
34.4%
SINGLE MOTHER POVERTY
0.0/ 100
METRIC RATING
314th/ 347
METRIC RANK
27.8%
SINGLE MOTHER POVERTY
98.0/ 100
METRIC RATING
91st/ 347
METRIC RANK
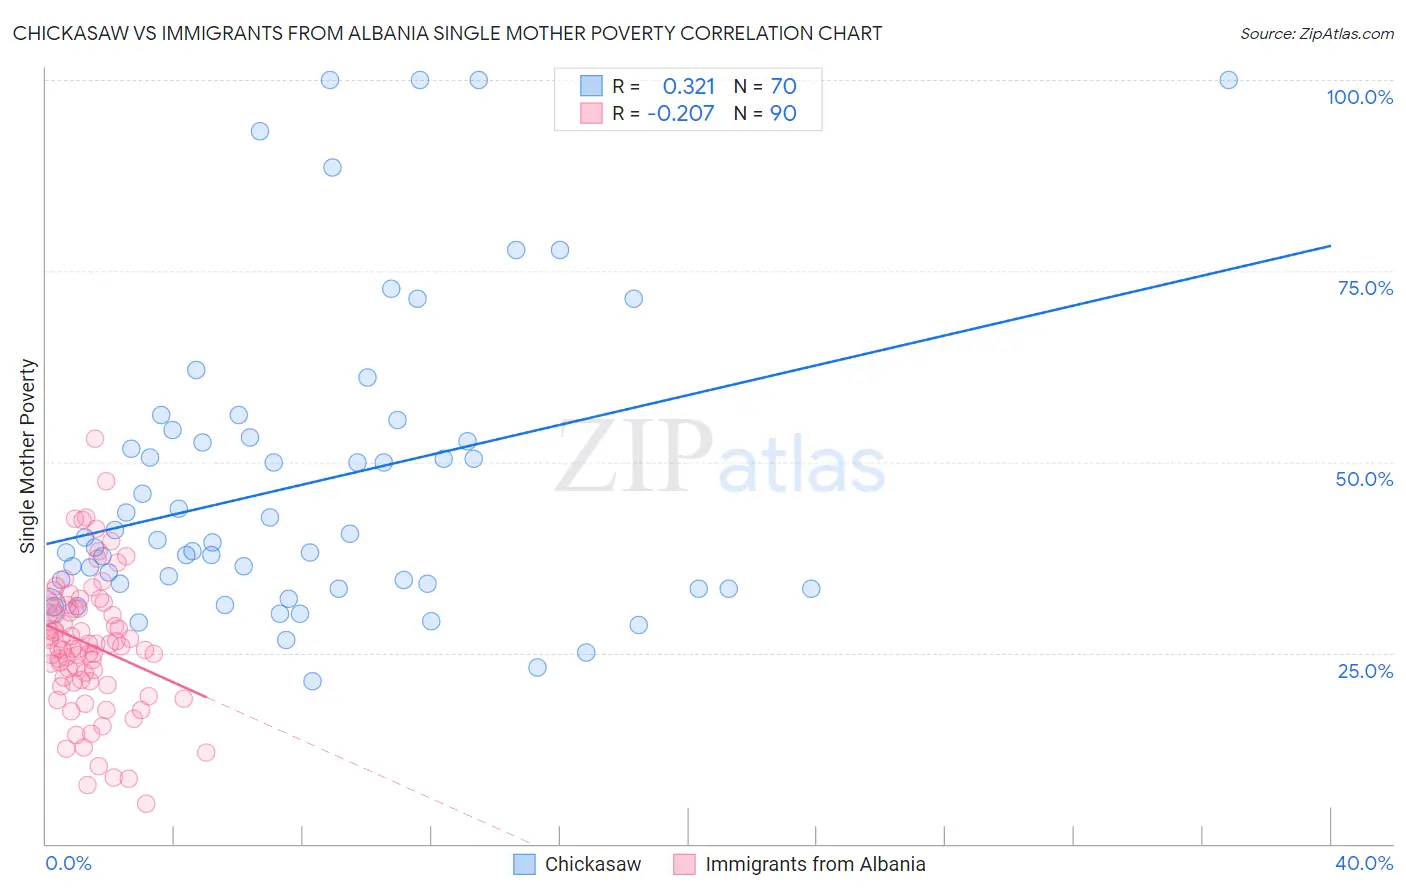
Chickasaw vs Immigrants from Albania Single Mother Poverty Correlation Chart
The statistical analysis conducted on geographies consisting of 146,526,184 people shows a mild positive correlation between the proportion of Chickasaw and poverty level among single mothers in the United States with a correlation coefficient (R) of 0.321 and weighted average of 34.4%. Similarly, the statistical analysis conducted on geographies consisting of 117,790,749 people shows a weak negative correlation between the proportion of Immigrants from Albania and poverty level among single mothers in the United States with a correlation coefficient (R) of -0.207 and weighted average of 27.8%, a difference of 23.7%.
Single Mother Poverty Correlation Summary
| Measurement | Chickasaw | Immigrants from Albania |
| Minimum | 21.2% | 5.2% |
| Maximum | 100.0% | 53.0% |
| Range | 78.7% | 47.8% |
| Mean | 47.2% | 26.1% |
| Median | 39.6% | 26.0% |
| Interquartile 25% (IQ1) | 33.3% | 21.3% |
| Interquartile 75% (IQ3) | 53.2% | 31.0% |
| Interquartile Range (IQR) | 19.9% | 9.7% |
| Standard Deviation (Sample) | 20.0% | 8.8% |
| Standard Deviation (Population) | 19.8% | 8.8% |
Similar Demographics by Single Mother Poverty
Demographics Similar to Chickasaw by Single Mother Poverty
In terms of single mother poverty, the demographic groups most similar to Chickasaw are Hopi (34.5%, a difference of 0.080%), Immigrants from Dominican Republic (34.4%, a difference of 0.17%), Dominican (34.5%, a difference of 0.20%), Central American Indian (34.3%, a difference of 0.26%), and Cherokee (34.5%, a difference of 0.30%).
| Demographics | Rating | Rank | Single Mother Poverty |
| Comanche | 0.0 /100 | #307 | Tragic 33.9% |
| Immigrants | Mexico | 0.0 /100 | #308 | Tragic 34.0% |
| Potawatomi | 0.0 /100 | #309 | Tragic 34.1% |
| Hondurans | 0.0 /100 | #310 | Tragic 34.2% |
| Alsatians | 0.0 /100 | #311 | Tragic 34.3% |
| Central American Indians | 0.0 /100 | #312 | Tragic 34.3% |
| Immigrants | Dominican Republic | 0.0 /100 | #313 | Tragic 34.4% |
| Chickasaw | 0.0 /100 | #314 | Tragic 34.4% |
| Hopi | 0.0 /100 | #315 | Tragic 34.5% |
| Dominicans | 0.0 /100 | #316 | Tragic 34.5% |
| Cherokee | 0.0 /100 | #317 | Tragic 34.5% |
| Immigrants | Honduras | 0.0 /100 | #318 | Tragic 34.7% |
| Chippewa | 0.0 /100 | #319 | Tragic 34.8% |
| Iroquois | 0.0 /100 | #320 | Tragic 34.8% |
| Paiute | 0.0 /100 | #321 | Tragic 35.1% |
Demographics Similar to Immigrants from Albania by Single Mother Poverty
In terms of single mother poverty, the demographic groups most similar to Immigrants from Albania are Estonian (27.8%, a difference of 0.030%), Romanian (27.8%, a difference of 0.12%), Immigrants from France (27.8%, a difference of 0.14%), Albanian (27.9%, a difference of 0.22%), and Chilean (27.9%, a difference of 0.25%).
| Demographics | Rating | Rank | Single Mother Poverty |
| Immigrants | Latvia | 98.7 /100 | #84 | Exceptional 27.7% |
| Mongolians | 98.7 /100 | #85 | Exceptional 27.7% |
| Immigrants | Ukraine | 98.6 /100 | #86 | Exceptional 27.7% |
| Afghans | 98.5 /100 | #87 | Exceptional 27.7% |
| Ethiopians | 98.4 /100 | #88 | Exceptional 27.7% |
| Immigrants | Ethiopia | 98.4 /100 | #89 | Exceptional 27.7% |
| Immigrants | France | 98.2 /100 | #90 | Exceptional 27.8% |
| Immigrants | Albania | 98.0 /100 | #91 | Exceptional 27.8% |
| Estonians | 97.9 /100 | #92 | Exceptional 27.8% |
| Romanians | 97.8 /100 | #93 | Exceptional 27.8% |
| Albanians | 97.6 /100 | #94 | Exceptional 27.9% |
| Chileans | 97.5 /100 | #95 | Exceptional 27.9% |
| Immigrants | Iraq | 97.3 /100 | #96 | Exceptional 27.9% |
| Immigrants | Brazil | 97.2 /100 | #97 | Exceptional 27.9% |
| Immigrants | Nepal | 97.2 /100 | #98 | Exceptional 27.9% |