Cree vs British West Indian Poverty
COMPARE
Cree
British West Indian
Poverty
Poverty Comparison
Cree
British West Indians
14.2%
POVERTY
0.2/ 100
METRIC RATING
250th/ 347
METRIC RANK
15.9%
POVERTY
0.0/ 100
METRIC RATING
315th/ 347
METRIC RANK
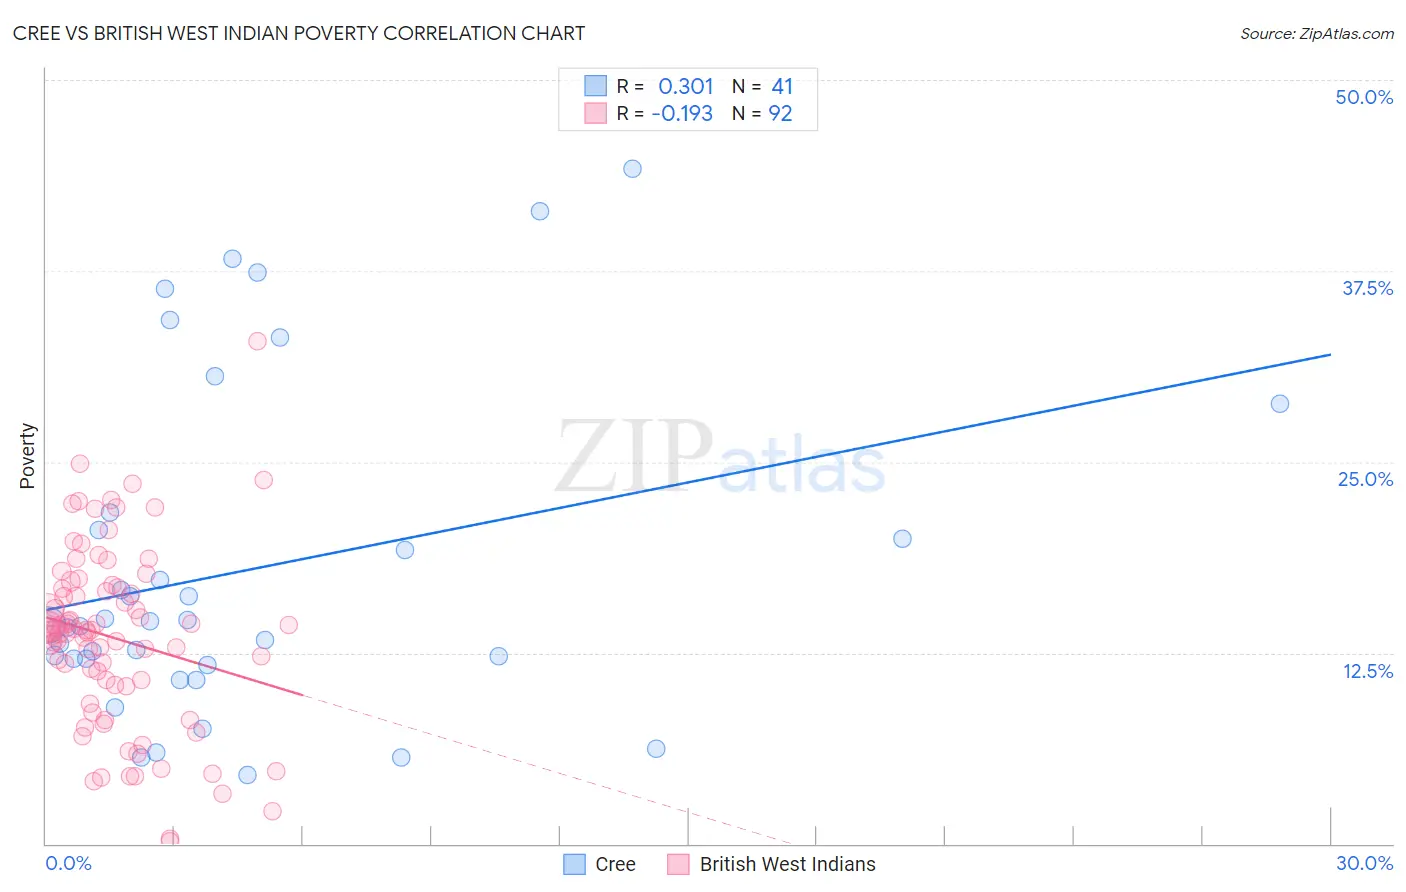
Cree vs British West Indian Poverty Correlation Chart
The statistical analysis conducted on geographies consisting of 76,209,034 people shows a mild positive correlation between the proportion of Cree and poverty level in the United States with a correlation coefficient (R) of 0.301 and weighted average of 14.2%. Similarly, the statistical analysis conducted on geographies consisting of 152,630,673 people shows a poor negative correlation between the proportion of British West Indians and poverty level in the United States with a correlation coefficient (R) of -0.193 and weighted average of 15.9%, a difference of 11.7%.
Poverty Correlation Summary
| Measurement | Cree | British West Indian |
| Minimum | 4.5% | 0.13% |
| Maximum | 44.2% | 32.9% |
| Range | 39.7% | 32.8% |
| Mean | 18.0% | 13.5% |
| Median | 14.3% | 14.0% |
| Interquartile 25% (IQ1) | 11.9% | 10.3% |
| Interquartile 75% (IQ3) | 21.1% | 16.8% |
| Interquartile Range (IQR) | 9.2% | 6.4% |
| Standard Deviation (Sample) | 10.7% | 5.9% |
| Standard Deviation (Population) | 10.6% | 5.9% |
Similar Demographics by Poverty
Demographics Similar to Cree by Poverty
In terms of poverty, the demographic groups most similar to Cree are Immigrants from Burma/Myanmar (14.2%, a difference of 0.090%), Spanish American Indian (14.2%, a difference of 0.20%), Immigrants from Ghana (14.2%, a difference of 0.30%), Immigrants from Trinidad and Tobago (14.2%, a difference of 0.31%), and Immigrants from Western Africa (14.1%, a difference of 0.39%).
| Demographics | Rating | Rank | Poverty |
| Sudanese | 0.3 /100 | #243 | Tragic 14.0% |
| Nepalese | 0.3 /100 | #244 | Tragic 14.0% |
| Immigrants | Sudan | 0.3 /100 | #245 | Tragic 14.1% |
| Potawatomi | 0.3 /100 | #246 | Tragic 14.1% |
| Liberians | 0.2 /100 | #247 | Tragic 14.1% |
| Immigrants | Western Africa | 0.2 /100 | #248 | Tragic 14.1% |
| Immigrants | Ghana | 0.2 /100 | #249 | Tragic 14.2% |
| Cree | 0.2 /100 | #250 | Tragic 14.2% |
| Immigrants | Burma/Myanmar | 0.2 /100 | #251 | Tragic 14.2% |
| Spanish American Indians | 0.2 /100 | #252 | Tragic 14.2% |
| Immigrants | Trinidad and Tobago | 0.2 /100 | #253 | Tragic 14.2% |
| Immigrants | El Salvador | 0.1 /100 | #254 | Tragic 14.3% |
| Immigrants | Ecuador | 0.1 /100 | #255 | Tragic 14.3% |
| Mexican American Indians | 0.1 /100 | #256 | Tragic 14.3% |
| Trinidadians and Tobagonians | 0.1 /100 | #257 | Tragic 14.3% |
Demographics Similar to British West Indians by Poverty
In terms of poverty, the demographic groups most similar to British West Indians are Honduran (15.9%, a difference of 0.0%), Immigrants from Somalia (15.8%, a difference of 0.37%), Immigrants from Grenada (15.8%, a difference of 0.49%), Cajun (15.7%, a difference of 0.93%), and Chippewa (15.7%, a difference of 1.1%).
| Demographics | Rating | Rank | Poverty |
| Choctaw | 0.0 /100 | #308 | Tragic 15.6% |
| Seminole | 0.0 /100 | #309 | Tragic 15.6% |
| Dutch West Indians | 0.0 /100 | #310 | Tragic 15.6% |
| Chippewa | 0.0 /100 | #311 | Tragic 15.7% |
| Cajuns | 0.0 /100 | #312 | Tragic 15.7% |
| Immigrants | Grenada | 0.0 /100 | #313 | Tragic 15.8% |
| Immigrants | Somalia | 0.0 /100 | #314 | Tragic 15.8% |
| British West Indians | 0.0 /100 | #315 | Tragic 15.9% |
| Hondurans | 0.0 /100 | #316 | Tragic 15.9% |
| U.S. Virgin Islanders | 0.0 /100 | #317 | Tragic 16.1% |
| Immigrants | Dominica | 0.0 /100 | #318 | Tragic 16.1% |
| Immigrants | Congo | 0.0 /100 | #319 | Tragic 16.1% |
| Immigrants | Honduras | 0.0 /100 | #320 | Tragic 16.2% |
| Arapaho | 0.0 /100 | #321 | Tragic 16.3% |
| Menominee | 0.0 /100 | #322 | Tragic 16.4% |