Cree vs South American Poverty
COMPARE
Cree
South American
Poverty
Poverty Comparison
Cree
South Americans
14.2%
POVERTY
0.2/ 100
METRIC RATING
250th/ 347
METRIC RANK
12.3%
POVERTY
48.7/ 100
METRIC RATING
175th/ 347
METRIC RANK
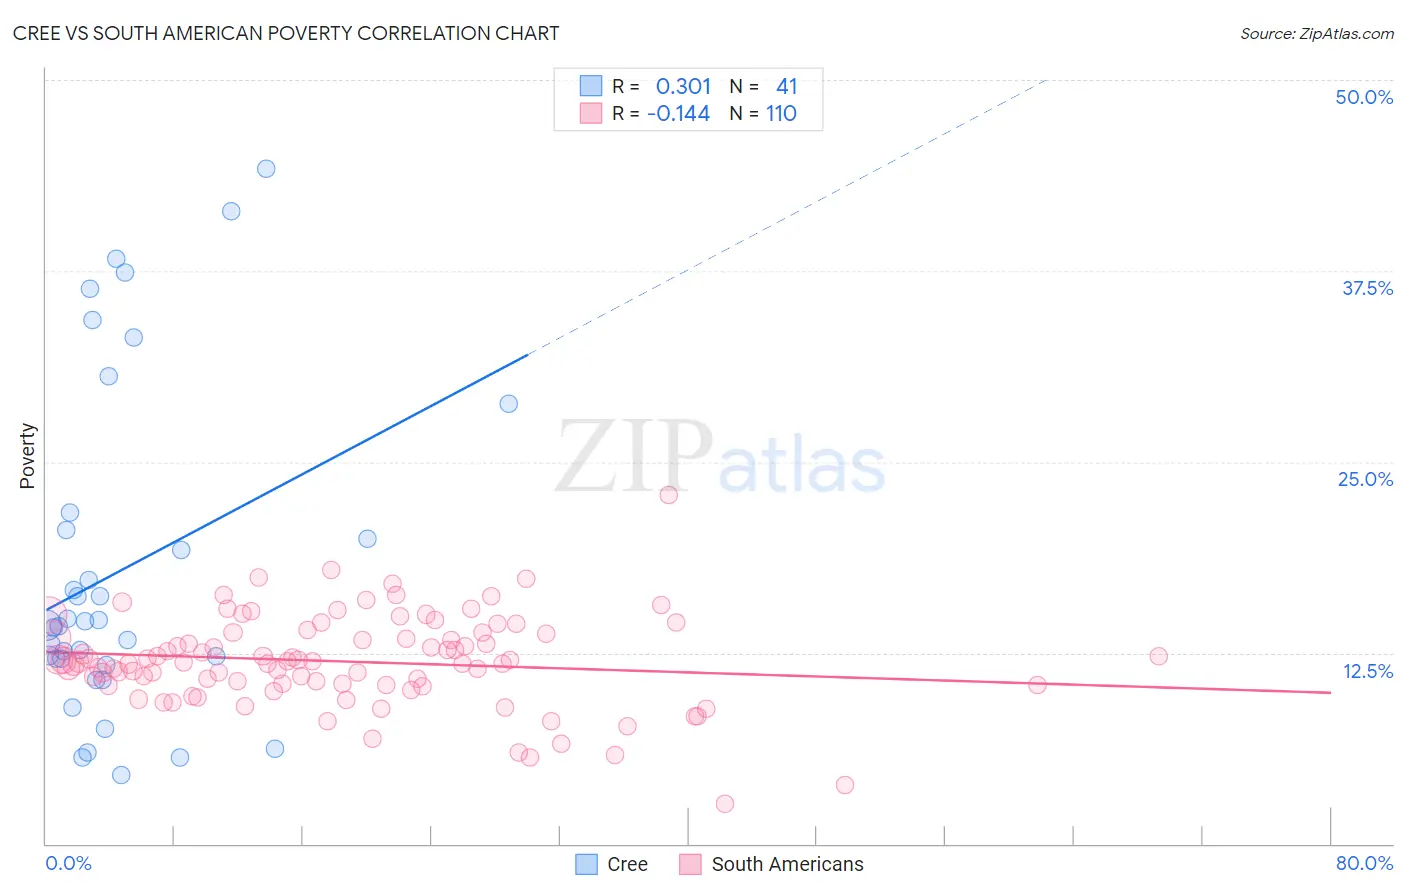
Cree vs South American Poverty Correlation Chart
The statistical analysis conducted on geographies consisting of 76,209,034 people shows a mild positive correlation between the proportion of Cree and poverty level in the United States with a correlation coefficient (R) of 0.301 and weighted average of 14.2%. Similarly, the statistical analysis conducted on geographies consisting of 493,572,716 people shows a poor negative correlation between the proportion of South Americans and poverty level in the United States with a correlation coefficient (R) of -0.144 and weighted average of 12.3%, a difference of 15.1%.
Poverty Correlation Summary
| Measurement | Cree | South American |
| Minimum | 4.5% | 2.6% |
| Maximum | 44.2% | 22.8% |
| Range | 39.7% | 20.2% |
| Mean | 18.0% | 11.9% |
| Median | 14.3% | 11.9% |
| Interquartile 25% (IQ1) | 11.9% | 10.4% |
| Interquartile 75% (IQ3) | 21.1% | 13.8% |
| Interquartile Range (IQR) | 9.2% | 3.4% |
| Standard Deviation (Sample) | 10.7% | 3.0% |
| Standard Deviation (Population) | 10.6% | 3.0% |
Similar Demographics by Poverty
Demographics Similar to Cree by Poverty
In terms of poverty, the demographic groups most similar to Cree are Immigrants from Burma/Myanmar (14.2%, a difference of 0.090%), Spanish American Indian (14.2%, a difference of 0.20%), Immigrants from Ghana (14.2%, a difference of 0.30%), Immigrants from Trinidad and Tobago (14.2%, a difference of 0.31%), and Immigrants from Western Africa (14.1%, a difference of 0.39%).
| Demographics | Rating | Rank | Poverty |
| Sudanese | 0.3 /100 | #243 | Tragic 14.0% |
| Nepalese | 0.3 /100 | #244 | Tragic 14.0% |
| Immigrants | Sudan | 0.3 /100 | #245 | Tragic 14.1% |
| Potawatomi | 0.3 /100 | #246 | Tragic 14.1% |
| Liberians | 0.2 /100 | #247 | Tragic 14.1% |
| Immigrants | Western Africa | 0.2 /100 | #248 | Tragic 14.1% |
| Immigrants | Ghana | 0.2 /100 | #249 | Tragic 14.2% |
| Cree | 0.2 /100 | #250 | Tragic 14.2% |
| Immigrants | Burma/Myanmar | 0.2 /100 | #251 | Tragic 14.2% |
| Spanish American Indians | 0.2 /100 | #252 | Tragic 14.2% |
| Immigrants | Trinidad and Tobago | 0.2 /100 | #253 | Tragic 14.2% |
| Immigrants | El Salvador | 0.1 /100 | #254 | Tragic 14.3% |
| Immigrants | Ecuador | 0.1 /100 | #255 | Tragic 14.3% |
| Mexican American Indians | 0.1 /100 | #256 | Tragic 14.3% |
| Trinidadians and Tobagonians | 0.1 /100 | #257 | Tragic 14.3% |
Demographics Similar to South Americans by Poverty
In terms of poverty, the demographic groups most similar to South Americans are Immigrants from Colombia (12.3%, a difference of 0.090%), Immigrants from Syria (12.3%, a difference of 0.12%), Lebanese (12.3%, a difference of 0.13%), Celtic (12.3%, a difference of 0.14%), and Immigrants from Portugal (12.3%, a difference of 0.18%).
| Demographics | Rating | Rank | Poverty |
| Immigrants | Venezuela | 56.5 /100 | #168 | Average 12.2% |
| Whites/Caucasians | 55.4 /100 | #169 | Average 12.3% |
| Immigrants | Oceania | 54.6 /100 | #170 | Average 12.3% |
| Immigrants | Spain | 51.3 /100 | #171 | Average 12.3% |
| Immigrants | Portugal | 50.5 /100 | #172 | Average 12.3% |
| Celtics | 50.1 /100 | #173 | Average 12.3% |
| Lebanese | 50.0 /100 | #174 | Average 12.3% |
| South Americans | 48.7 /100 | #175 | Average 12.3% |
| Immigrants | Colombia | 47.7 /100 | #176 | Average 12.3% |
| Immigrants | Syria | 47.5 /100 | #177 | Average 12.3% |
| Uruguayans | 44.7 /100 | #178 | Average 12.4% |
| Immigrants | Morocco | 44.0 /100 | #179 | Average 12.4% |
| Mongolians | 43.6 /100 | #180 | Average 12.4% |
| Immigrants | Afghanistan | 42.1 /100 | #181 | Average 12.4% |
| Immigrants | Cameroon | 41.7 /100 | #182 | Average 12.4% |