Cree vs Croatian Poverty
COMPARE
Cree
Croatian
Poverty
Poverty Comparison
Cree
Croatians
14.2%
POVERTY
0.2/ 100
METRIC RATING
250th/ 347
METRIC RANK
10.6%
POVERTY
99.6/ 100
METRIC RATING
25th/ 347
METRIC RANK
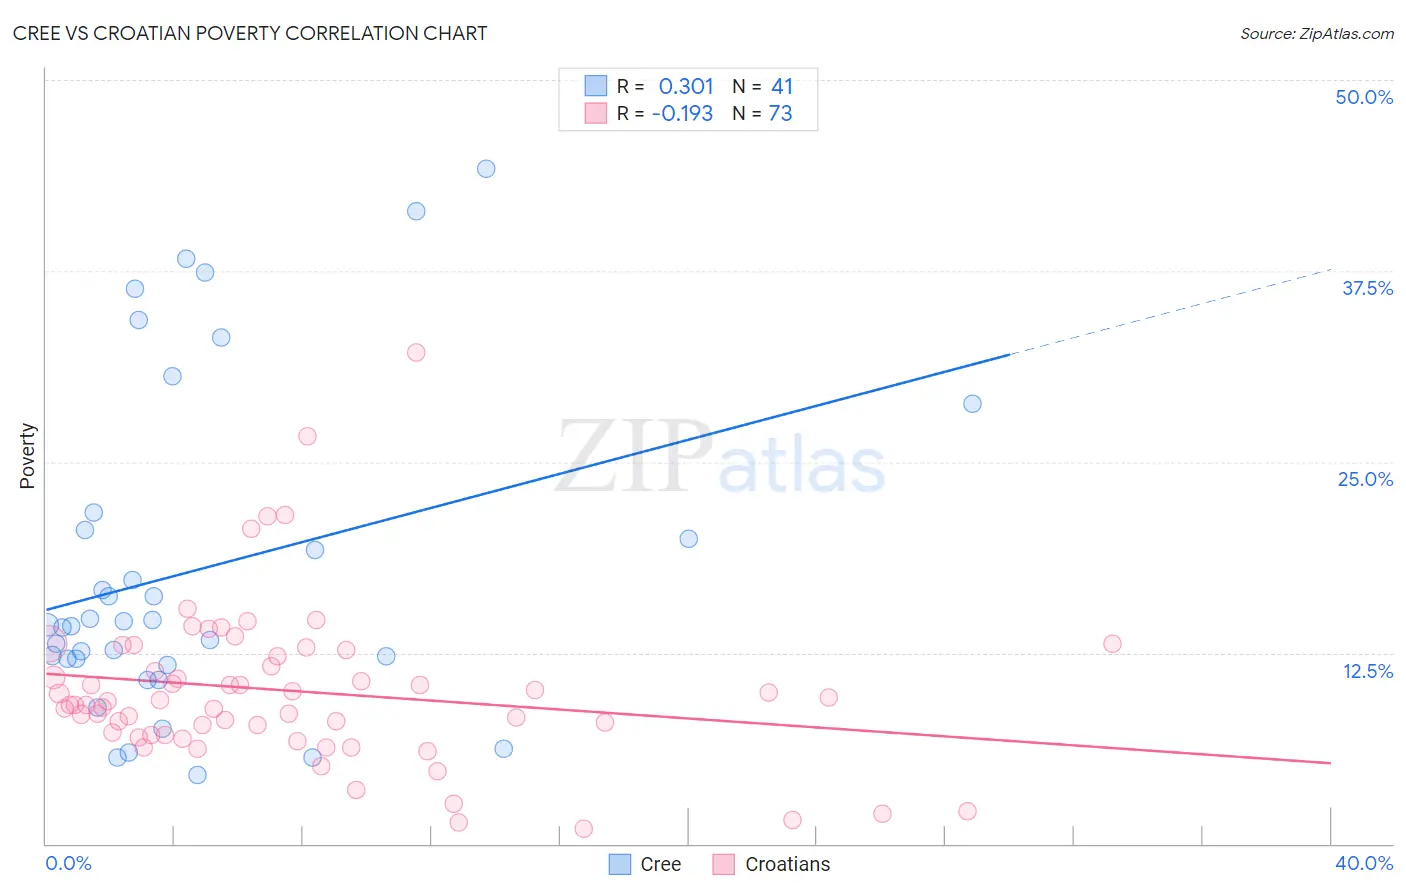
Cree vs Croatian Poverty Correlation Chart
The statistical analysis conducted on geographies consisting of 76,209,034 people shows a mild positive correlation between the proportion of Cree and poverty level in the United States with a correlation coefficient (R) of 0.301 and weighted average of 14.2%. Similarly, the statistical analysis conducted on geographies consisting of 375,543,328 people shows a poor negative correlation between the proportion of Croatians and poverty level in the United States with a correlation coefficient (R) of -0.193 and weighted average of 10.6%, a difference of 33.5%.
Poverty Correlation Summary
| Measurement | Cree | Croatian |
| Minimum | 4.5% | 0.99% |
| Maximum | 44.2% | 32.2% |
| Range | 39.7% | 31.2% |
| Mean | 18.0% | 10.0% |
| Median | 14.3% | 9.1% |
| Interquartile 25% (IQ1) | 11.9% | 7.1% |
| Interquartile 75% (IQ3) | 21.1% | 12.5% |
| Interquartile Range (IQR) | 9.2% | 5.4% |
| Standard Deviation (Sample) | 10.7% | 5.3% |
| Standard Deviation (Population) | 10.6% | 5.3% |
Similar Demographics by Poverty
Demographics Similar to Cree by Poverty
In terms of poverty, the demographic groups most similar to Cree are Immigrants from Burma/Myanmar (14.2%, a difference of 0.090%), Spanish American Indian (14.2%, a difference of 0.20%), Immigrants from Ghana (14.2%, a difference of 0.30%), Immigrants from Trinidad and Tobago (14.2%, a difference of 0.31%), and Immigrants from Western Africa (14.1%, a difference of 0.39%).
| Demographics | Rating | Rank | Poverty |
| Sudanese | 0.3 /100 | #243 | Tragic 14.0% |
| Nepalese | 0.3 /100 | #244 | Tragic 14.0% |
| Immigrants | Sudan | 0.3 /100 | #245 | Tragic 14.1% |
| Potawatomi | 0.3 /100 | #246 | Tragic 14.1% |
| Liberians | 0.2 /100 | #247 | Tragic 14.1% |
| Immigrants | Western Africa | 0.2 /100 | #248 | Tragic 14.1% |
| Immigrants | Ghana | 0.2 /100 | #249 | Tragic 14.2% |
| Cree | 0.2 /100 | #250 | Tragic 14.2% |
| Immigrants | Burma/Myanmar | 0.2 /100 | #251 | Tragic 14.2% |
| Spanish American Indians | 0.2 /100 | #252 | Tragic 14.2% |
| Immigrants | Trinidad and Tobago | 0.2 /100 | #253 | Tragic 14.2% |
| Immigrants | El Salvador | 0.1 /100 | #254 | Tragic 14.3% |
| Immigrants | Ecuador | 0.1 /100 | #255 | Tragic 14.3% |
| Mexican American Indians | 0.1 /100 | #256 | Tragic 14.3% |
| Trinidadians and Tobagonians | 0.1 /100 | #257 | Tragic 14.3% |
Demographics Similar to Croatians by Poverty
In terms of poverty, the demographic groups most similar to Croatians are Italian (10.6%, a difference of 0.19%), Swedish (10.6%, a difference of 0.24%), Burmese (10.7%, a difference of 0.31%), Eastern European (10.6%, a difference of 0.35%), and Luxembourger (10.6%, a difference of 0.51%).
| Demographics | Rating | Rank | Poverty |
| Latvians | 99.8 /100 | #18 | Exceptional 10.5% |
| Immigrants | Scotland | 99.7 /100 | #19 | Exceptional 10.6% |
| Immigrants | North Macedonia | 99.7 /100 | #20 | Exceptional 10.6% |
| Luxembourgers | 99.7 /100 | #21 | Exceptional 10.6% |
| Eastern Europeans | 99.7 /100 | #22 | Exceptional 10.6% |
| Swedes | 99.7 /100 | #23 | Exceptional 10.6% |
| Italians | 99.7 /100 | #24 | Exceptional 10.6% |
| Croatians | 99.6 /100 | #25 | Exceptional 10.6% |
| Burmese | 99.6 /100 | #26 | Exceptional 10.7% |
| Immigrants | Northern Europe | 99.6 /100 | #27 | Exceptional 10.7% |
| Immigrants | Korea | 99.5 /100 | #28 | Exceptional 10.7% |
| Greeks | 99.5 /100 | #29 | Exceptional 10.7% |
| Danes | 99.5 /100 | #30 | Exceptional 10.7% |
| Poles | 99.5 /100 | #31 | Exceptional 10.7% |
| Iranians | 99.5 /100 | #32 | Exceptional 10.7% |