Immigrants from Oceania vs British West Indian Poverty
COMPARE
Immigrants from Oceania
British West Indian
Poverty
Poverty Comparison
Immigrants from Oceania
British West Indians
12.3%
POVERTY
54.6/ 100
METRIC RATING
170th/ 347
METRIC RANK
15.9%
POVERTY
0.0/ 100
METRIC RATING
315th/ 347
METRIC RANK
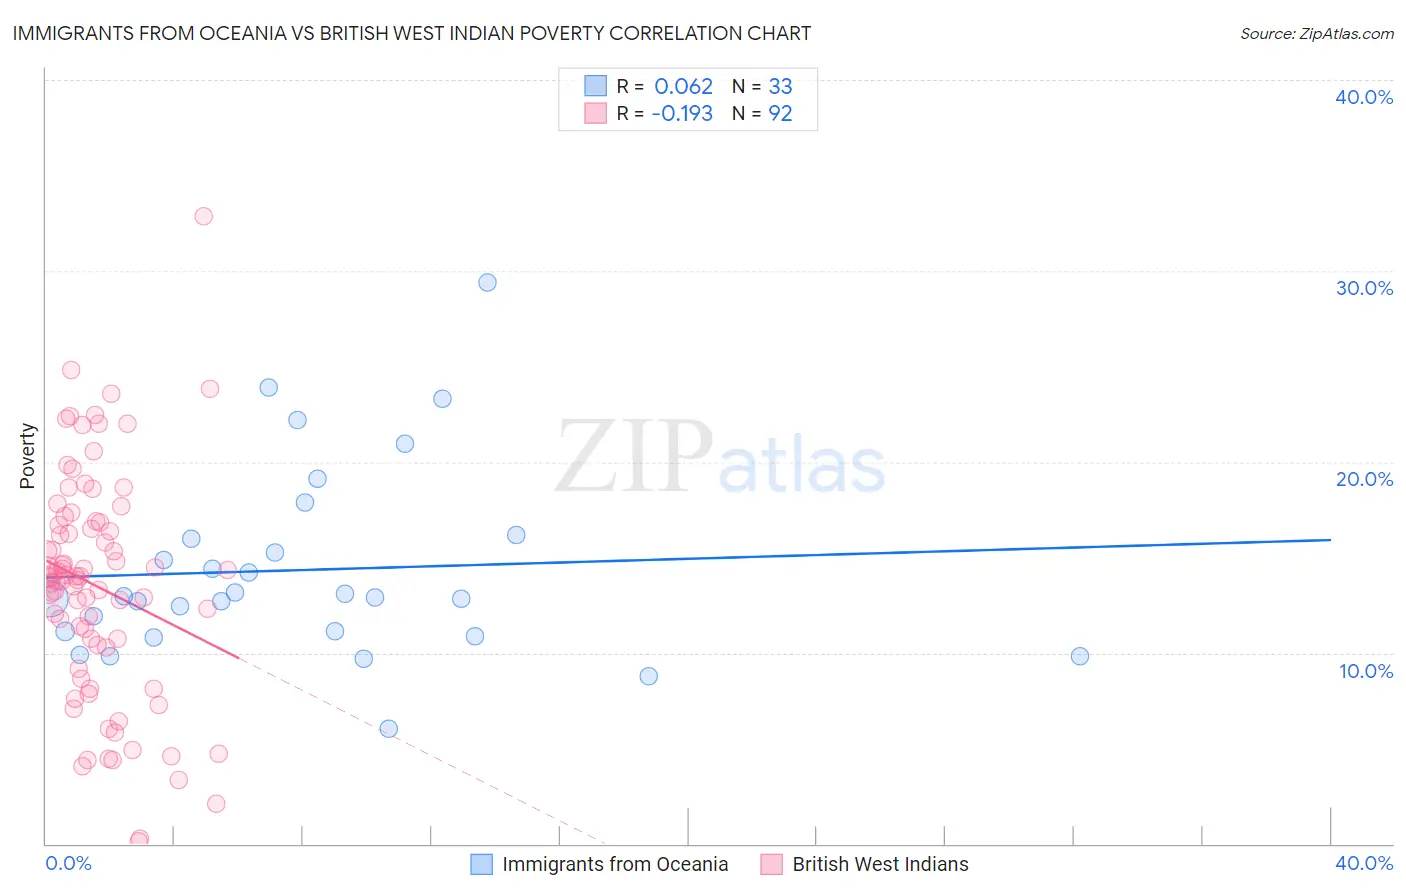
Immigrants from Oceania vs British West Indian Poverty Correlation Chart
The statistical analysis conducted on geographies consisting of 305,386,119 people shows a slight positive correlation between the proportion of Immigrants from Oceania and poverty level in the United States with a correlation coefficient (R) of 0.062 and weighted average of 12.3%. Similarly, the statistical analysis conducted on geographies consisting of 152,630,673 people shows a poor negative correlation between the proportion of British West Indians and poverty level in the United States with a correlation coefficient (R) of -0.193 and weighted average of 15.9%, a difference of 29.3%.
Poverty Correlation Summary
| Measurement | Immigrants from Oceania | British West Indian |
| Minimum | 6.0% | 0.13% |
| Maximum | 29.4% | 32.9% |
| Range | 23.4% | 32.8% |
| Mean | 14.3% | 13.5% |
| Median | 12.9% | 14.0% |
| Interquartile 25% (IQ1) | 11.0% | 10.3% |
| Interquartile 75% (IQ3) | 16.1% | 16.8% |
| Interquartile Range (IQR) | 5.1% | 6.4% |
| Standard Deviation (Sample) | 5.0% | 5.9% |
| Standard Deviation (Population) | 4.9% | 5.9% |
Similar Demographics by Poverty
Demographics Similar to Immigrants from Oceania by Poverty
In terms of poverty, the demographic groups most similar to Immigrants from Oceania are White/Caucasian (12.3%, a difference of 0.080%), Immigrants from Venezuela (12.2%, a difference of 0.19%), Immigrants from Chile (12.2%, a difference of 0.21%), Venezuelan (12.2%, a difference of 0.23%), and Immigrants from Albania (12.2%, a difference of 0.31%).
| Demographics | Rating | Rank | Poverty |
| Immigrants | Ethiopia | 58.6 /100 | #163 | Average 12.2% |
| Colombians | 57.8 /100 | #164 | Average 12.2% |
| Immigrants | Albania | 57.7 /100 | #165 | Average 12.2% |
| Venezuelans | 56.9 /100 | #166 | Average 12.2% |
| Immigrants | Chile | 56.7 /100 | #167 | Average 12.2% |
| Immigrants | Venezuela | 56.5 /100 | #168 | Average 12.2% |
| Whites/Caucasians | 55.4 /100 | #169 | Average 12.3% |
| Immigrants | Oceania | 54.6 /100 | #170 | Average 12.3% |
| Immigrants | Spain | 51.3 /100 | #171 | Average 12.3% |
| Immigrants | Portugal | 50.5 /100 | #172 | Average 12.3% |
| Celtics | 50.1 /100 | #173 | Average 12.3% |
| Lebanese | 50.0 /100 | #174 | Average 12.3% |
| South Americans | 48.7 /100 | #175 | Average 12.3% |
| Immigrants | Colombia | 47.7 /100 | #176 | Average 12.3% |
| Immigrants | Syria | 47.5 /100 | #177 | Average 12.3% |
Demographics Similar to British West Indians by Poverty
In terms of poverty, the demographic groups most similar to British West Indians are Honduran (15.9%, a difference of 0.0%), Immigrants from Somalia (15.8%, a difference of 0.37%), Immigrants from Grenada (15.8%, a difference of 0.49%), Cajun (15.7%, a difference of 0.93%), and Chippewa (15.7%, a difference of 1.1%).
| Demographics | Rating | Rank | Poverty |
| Choctaw | 0.0 /100 | #308 | Tragic 15.6% |
| Seminole | 0.0 /100 | #309 | Tragic 15.6% |
| Dutch West Indians | 0.0 /100 | #310 | Tragic 15.6% |
| Chippewa | 0.0 /100 | #311 | Tragic 15.7% |
| Cajuns | 0.0 /100 | #312 | Tragic 15.7% |
| Immigrants | Grenada | 0.0 /100 | #313 | Tragic 15.8% |
| Immigrants | Somalia | 0.0 /100 | #314 | Tragic 15.8% |
| British West Indians | 0.0 /100 | #315 | Tragic 15.9% |
| Hondurans | 0.0 /100 | #316 | Tragic 15.9% |
| U.S. Virgin Islanders | 0.0 /100 | #317 | Tragic 16.1% |
| Immigrants | Dominica | 0.0 /100 | #318 | Tragic 16.1% |
| Immigrants | Congo | 0.0 /100 | #319 | Tragic 16.1% |
| Immigrants | Honduras | 0.0 /100 | #320 | Tragic 16.2% |
| Arapaho | 0.0 /100 | #321 | Tragic 16.3% |
| Menominee | 0.0 /100 | #322 | Tragic 16.4% |