Cree vs British West Indian 2 or more Vehicles in Household
COMPARE
Cree
British West Indian
2 or more Vehicles in Household
2 or more Vehicles in Household Comparison
Cree
British West Indians
55.1%
2 OR MORE VEHICLES IN HOUSEHOLD
38.2/ 100
METRIC RATING
182nd/ 347
METRIC RANK
35.4%
2 OR MORE VEHICLES IN HOUSEHOLD
0.0/ 100
METRIC RATING
340th/ 347
METRIC RANK
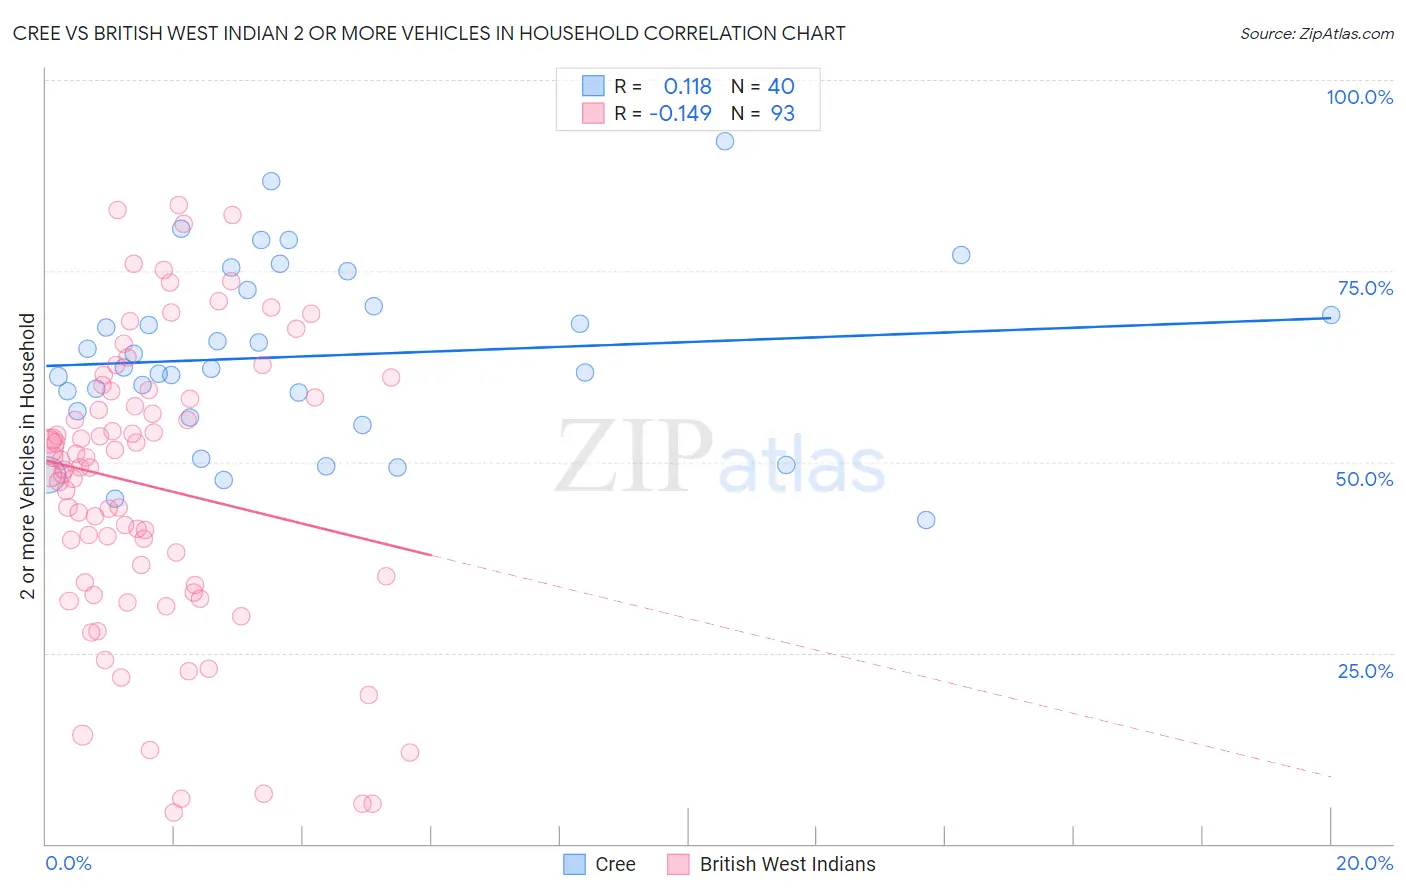
Cree vs British West Indian 2 or more Vehicles in Household Correlation Chart
The statistical analysis conducted on geographies consisting of 76,210,632 people shows a poor positive correlation between the proportion of Cree and percentage of households with 2 or more vehicles available in the United States with a correlation coefficient (R) of 0.118 and weighted average of 55.1%. Similarly, the statistical analysis conducted on geographies consisting of 152,636,759 people shows a poor negative correlation between the proportion of British West Indians and percentage of households with 2 or more vehicles available in the United States with a correlation coefficient (R) of -0.149 and weighted average of 35.4%, a difference of 55.6%.
2 or more Vehicles in Household Correlation Summary
| Measurement | Cree | British West Indian |
| Minimum | 42.4% | 4.2% |
| Maximum | 91.9% | 83.7% |
| Range | 49.6% | 79.5% |
| Mean | 63.9% | 46.8% |
| Median | 62.3% | 49.3% |
| Interquartile 25% (IQ1) | 56.2% | 34.0% |
| Interquartile 75% (IQ3) | 71.4% | 58.8% |
| Interquartile Range (IQR) | 15.2% | 24.8% |
| Standard Deviation (Sample) | 11.6% | 18.9% |
| Standard Deviation (Population) | 11.5% | 18.8% |
Similar Demographics by 2 or more Vehicles in Household
Demographics Similar to Cree by 2 or more Vehicles in Household
In terms of 2 or more vehicles in household, the demographic groups most similar to Cree are Immigrants from Micronesia (55.1%, a difference of 0.0%), Immigrants from Cameroon (55.1%, a difference of 0.040%), Apache (55.1%, a difference of 0.060%), Immigrants from Kenya (55.1%, a difference of 0.090%), and Arab (55.0%, a difference of 0.10%).
| Demographics | Rating | Rank | 2 or more Vehicles in Household |
| Immigrants | Denmark | 49.4 /100 | #175 | Average 55.3% |
| Immigrants | Cuba | 47.0 /100 | #176 | Average 55.3% |
| Menominee | 46.2 /100 | #177 | Average 55.3% |
| Immigrants | Sweden | 45.3 /100 | #178 | Average 55.2% |
| Alaskan Athabascans | 42.9 /100 | #179 | Average 55.2% |
| Immigrants | Kenya | 40.4 /100 | #180 | Average 55.1% |
| Immigrants | Micronesia | 38.2 /100 | #181 | Fair 55.1% |
| Cree | 38.2 /100 | #182 | Fair 55.1% |
| Immigrants | Cameroon | 37.3 /100 | #183 | Fair 55.1% |
| Apache | 36.7 /100 | #184 | Fair 55.1% |
| Arabs | 35.9 /100 | #185 | Fair 55.0% |
| Peruvians | 33.7 /100 | #186 | Fair 55.0% |
| Immigrants | Uganda | 33.4 /100 | #187 | Fair 55.0% |
| Marshallese | 30.5 /100 | #188 | Fair 54.9% |
| Eastern Europeans | 27.5 /100 | #189 | Fair 54.8% |
Demographics Similar to British West Indians by 2 or more Vehicles in Household
In terms of 2 or more vehicles in household, the demographic groups most similar to British West Indians are Guyanese (35.4%, a difference of 0.070%), Dominican (35.3%, a difference of 0.25%), Immigrants from Barbados (35.8%, a difference of 1.1%), Immigrants from Guyana (35.0%, a difference of 1.1%), and Yup'ik (34.9%, a difference of 1.3%).
| Demographics | Rating | Rank | 2 or more Vehicles in Household |
| Immigrants | Ecuador | 0.0 /100 | #333 | Tragic 40.5% |
| Immigrants | Trinidad and Tobago | 0.0 /100 | #334 | Tragic 40.3% |
| Immigrants | Bangladesh | 0.0 /100 | #335 | Tragic 38.8% |
| Vietnamese | 0.0 /100 | #336 | Tragic 38.5% |
| Barbadians | 0.0 /100 | #337 | Tragic 38.3% |
| Immigrants | Uzbekistan | 0.0 /100 | #338 | Tragic 37.9% |
| Immigrants | Barbados | 0.0 /100 | #339 | Tragic 35.8% |
| British West Indians | 0.0 /100 | #340 | Tragic 35.4% |
| Guyanese | 0.0 /100 | #341 | Tragic 35.4% |
| Dominicans | 0.0 /100 | #342 | Tragic 35.3% |
| Immigrants | Guyana | 0.0 /100 | #343 | Tragic 35.0% |
| Yup'ik | 0.0 /100 | #344 | Tragic 34.9% |
| Immigrants | Dominican Republic | 0.0 /100 | #345 | Tragic 33.2% |
| Immigrants | St. Vincent and the Grenadines | 0.0 /100 | #346 | Tragic 31.0% |
| Immigrants | Grenada | 0.0 /100 | #347 | Tragic 28.7% |