Costa Rican vs Iroquois Single Mother Poverty
COMPARE
Costa Rican
Iroquois
Single Mother Poverty
Single Mother Poverty Comparison
Costa Ricans
Iroquois
29.0%
SINGLE MOTHER POVERTY
58.4/ 100
METRIC RATING
167th/ 347
METRIC RANK
34.8%
SINGLE MOTHER POVERTY
0.0/ 100
METRIC RATING
320th/ 347
METRIC RANK
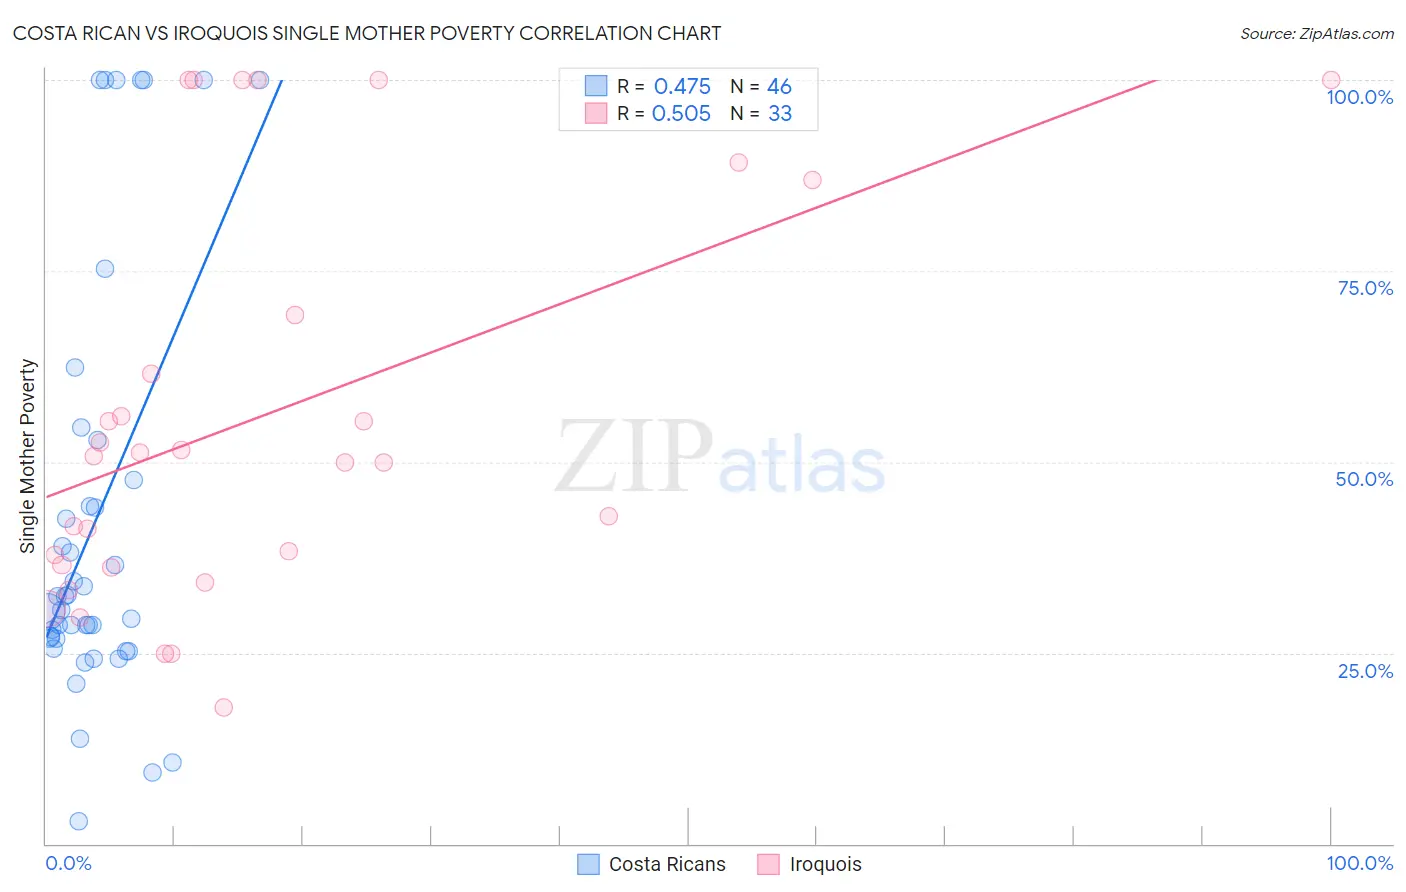
Costa Rican vs Iroquois Single Mother Poverty Correlation Chart
The statistical analysis conducted on geographies consisting of 249,968,027 people shows a moderate positive correlation between the proportion of Costa Ricans and poverty level among single mothers in the United States with a correlation coefficient (R) of 0.475 and weighted average of 29.0%. Similarly, the statistical analysis conducted on geographies consisting of 204,844,819 people shows a substantial positive correlation between the proportion of Iroquois and poverty level among single mothers in the United States with a correlation coefficient (R) of 0.505 and weighted average of 34.8%, a difference of 20.0%.
Single Mother Poverty Correlation Summary
| Measurement | Costa Rican | Iroquois |
| Minimum | 3.0% | 17.9% |
| Maximum | 100.0% | 100.0% |
| Range | 97.0% | 82.1% |
| Mean | 42.4% | 56.0% |
| Median | 31.5% | 50.8% |
| Interquartile 25% (IQ1) | 26.9% | 36.4% |
| Interquartile 75% (IQ3) | 47.6% | 78.1% |
| Interquartile Range (IQR) | 20.7% | 41.7% |
| Standard Deviation (Sample) | 27.7% | 26.1% |
| Standard Deviation (Population) | 27.4% | 25.7% |
Similar Demographics by Single Mother Poverty
Demographics Similar to Costa Ricans by Single Mother Poverty
In terms of single mother poverty, the demographic groups most similar to Costa Ricans are European (29.1%, a difference of 0.040%), Immigrants from Uruguay (29.1%, a difference of 0.060%), Inupiat (29.0%, a difference of 0.10%), Arab (29.0%, a difference of 0.12%), and New Zealander (29.1%, a difference of 0.16%).
| Demographics | Rating | Rank | Single Mother Poverty |
| Japanese | 68.0 /100 | #160 | Good 28.9% |
| Immigrants | Cambodia | 66.6 /100 | #161 | Good 28.9% |
| Scandinavians | 66.2 /100 | #162 | Good 28.9% |
| Immigrants | Nigeria | 65.9 /100 | #163 | Good 28.9% |
| Immigrants | Kenya | 65.9 /100 | #164 | Good 28.9% |
| Arabs | 60.7 /100 | #165 | Good 29.0% |
| Inupiat | 60.4 /100 | #166 | Good 29.0% |
| Costa Ricans | 58.4 /100 | #167 | Average 29.0% |
| Europeans | 57.6 /100 | #168 | Average 29.1% |
| Immigrants | Uruguay | 57.2 /100 | #169 | Average 29.1% |
| New Zealanders | 55.1 /100 | #170 | Average 29.1% |
| Puget Sound Salish | 55.1 /100 | #171 | Average 29.1% |
| Carpatho Rusyns | 53.8 /100 | #172 | Average 29.1% |
| British | 50.6 /100 | #173 | Average 29.2% |
| Immigrants | Saudi Arabia | 50.0 /100 | #174 | Average 29.2% |
Demographics Similar to Iroquois by Single Mother Poverty
In terms of single mother poverty, the demographic groups most similar to Iroquois are Chippewa (34.8%, a difference of 0.24%), Immigrants from Honduras (34.7%, a difference of 0.39%), Paiute (35.1%, a difference of 0.87%), Cherokee (34.5%, a difference of 0.91%), and Dominican (34.5%, a difference of 1.0%).
| Demographics | Rating | Rank | Single Mother Poverty |
| Immigrants | Dominican Republic | 0.0 /100 | #313 | Tragic 34.4% |
| Chickasaw | 0.0 /100 | #314 | Tragic 34.4% |
| Hopi | 0.0 /100 | #315 | Tragic 34.5% |
| Dominicans | 0.0 /100 | #316 | Tragic 34.5% |
| Cherokee | 0.0 /100 | #317 | Tragic 34.5% |
| Immigrants | Honduras | 0.0 /100 | #318 | Tragic 34.7% |
| Chippewa | 0.0 /100 | #319 | Tragic 34.8% |
| Iroquois | 0.0 /100 | #320 | Tragic 34.8% |
| Paiute | 0.0 /100 | #321 | Tragic 35.1% |
| Blacks/African Americans | 0.0 /100 | #322 | Tragic 35.2% |
| Kiowa | 0.0 /100 | #323 | Tragic 35.5% |
| Ottawa | 0.0 /100 | #324 | Tragic 35.5% |
| Ute | 0.0 /100 | #325 | Tragic 35.7% |
| Seminole | 0.0 /100 | #326 | Tragic 35.8% |
| Yakama | 0.0 /100 | #327 | Tragic 36.4% |