Slavic vs Iroquois Single Mother Poverty
COMPARE
Slavic
Iroquois
Single Mother Poverty
Single Mother Poverty Comparison
Slavs
Iroquois
29.6%
SINGLE MOTHER POVERTY
24.5/ 100
METRIC RATING
195th/ 347
METRIC RANK
34.8%
SINGLE MOTHER POVERTY
0.0/ 100
METRIC RATING
320th/ 347
METRIC RANK
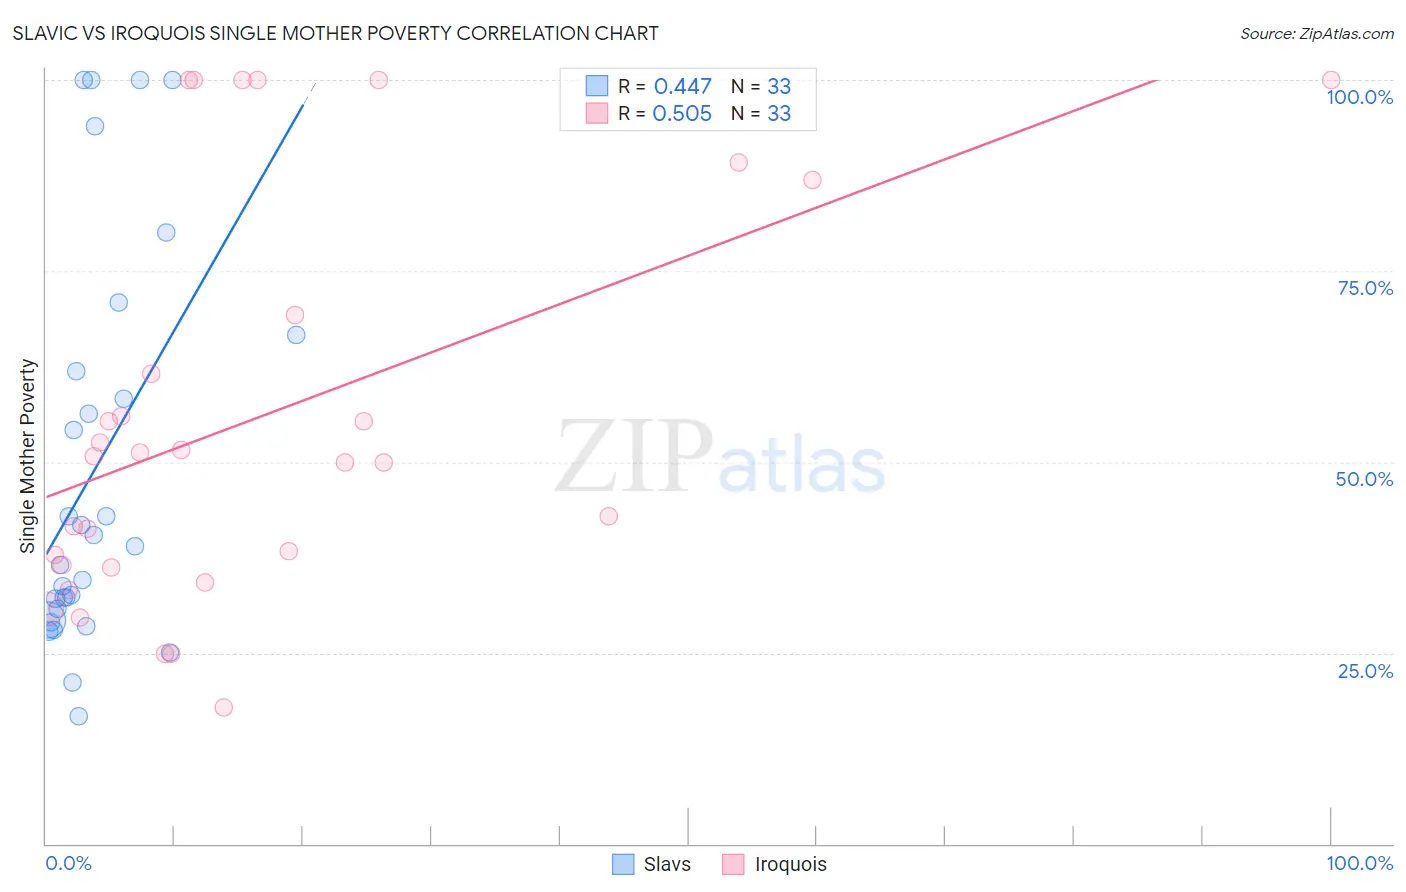
Slavic vs Iroquois Single Mother Poverty Correlation Chart
The statistical analysis conducted on geographies consisting of 265,304,000 people shows a moderate positive correlation between the proportion of Slavs and poverty level among single mothers in the United States with a correlation coefficient (R) of 0.447 and weighted average of 29.6%. Similarly, the statistical analysis conducted on geographies consisting of 204,844,819 people shows a substantial positive correlation between the proportion of Iroquois and poverty level among single mothers in the United States with a correlation coefficient (R) of 0.505 and weighted average of 34.8%, a difference of 17.9%.
Single Mother Poverty Correlation Summary
| Measurement | Slavic | Iroquois |
| Minimum | 16.7% | 17.9% |
| Maximum | 100.0% | 100.0% |
| Range | 83.3% | 82.1% |
| Mean | 49.1% | 56.0% |
| Median | 38.9% | 50.8% |
| Interquartile 25% (IQ1) | 30.0% | 36.4% |
| Interquartile 75% (IQ3) | 64.3% | 78.1% |
| Interquartile Range (IQR) | 34.3% | 41.7% |
| Standard Deviation (Sample) | 25.8% | 26.1% |
| Standard Deviation (Population) | 25.4% | 25.7% |
Similar Demographics by Single Mother Poverty
Demographics Similar to Slavs by Single Mother Poverty
In terms of single mother poverty, the demographic groups most similar to Slavs are Spanish American Indian (29.6%, a difference of 0.070%), Icelander (29.5%, a difference of 0.10%), Immigrants from Jamaica (29.6%, a difference of 0.17%), Trinidadian and Tobagonian (29.6%, a difference of 0.18%), and Basque (29.5%, a difference of 0.23%).
| Demographics | Rating | Rank | Single Mother Poverty |
| Guamanians/Chamorros | 31.8 /100 | #188 | Fair 29.4% |
| Immigrants | Africa | 31.6 /100 | #189 | Fair 29.4% |
| Immigrants | Germany | 30.4 /100 | #190 | Fair 29.5% |
| Immigrants | Trinidad and Tobago | 29.2 /100 | #191 | Fair 29.5% |
| Moroccans | 28.6 /100 | #192 | Fair 29.5% |
| Basques | 28.3 /100 | #193 | Fair 29.5% |
| Icelanders | 26.1 /100 | #194 | Fair 29.5% |
| Slavs | 24.5 /100 | #195 | Fair 29.6% |
| Spanish American Indians | 23.4 /100 | #196 | Fair 29.6% |
| Immigrants | Jamaica | 22.0 /100 | #197 | Fair 29.6% |
| Trinidadians and Tobagonians | 21.7 /100 | #198 | Fair 29.6% |
| Cubans | 20.8 /100 | #199 | Fair 29.6% |
| Panamanians | 20.0 /100 | #200 | Fair 29.6% |
| Belgians | 18.8 /100 | #201 | Poor 29.7% |
| Malaysians | 17.4 /100 | #202 | Poor 29.7% |
Demographics Similar to Iroquois by Single Mother Poverty
In terms of single mother poverty, the demographic groups most similar to Iroquois are Chippewa (34.8%, a difference of 0.24%), Immigrants from Honduras (34.7%, a difference of 0.39%), Paiute (35.1%, a difference of 0.87%), Cherokee (34.5%, a difference of 0.91%), and Dominican (34.5%, a difference of 1.0%).
| Demographics | Rating | Rank | Single Mother Poverty |
| Immigrants | Dominican Republic | 0.0 /100 | #313 | Tragic 34.4% |
| Chickasaw | 0.0 /100 | #314 | Tragic 34.4% |
| Hopi | 0.0 /100 | #315 | Tragic 34.5% |
| Dominicans | 0.0 /100 | #316 | Tragic 34.5% |
| Cherokee | 0.0 /100 | #317 | Tragic 34.5% |
| Immigrants | Honduras | 0.0 /100 | #318 | Tragic 34.7% |
| Chippewa | 0.0 /100 | #319 | Tragic 34.8% |
| Iroquois | 0.0 /100 | #320 | Tragic 34.8% |
| Paiute | 0.0 /100 | #321 | Tragic 35.1% |
| Blacks/African Americans | 0.0 /100 | #322 | Tragic 35.2% |
| Kiowa | 0.0 /100 | #323 | Tragic 35.5% |
| Ottawa | 0.0 /100 | #324 | Tragic 35.5% |
| Ute | 0.0 /100 | #325 | Tragic 35.7% |
| Seminole | 0.0 /100 | #326 | Tragic 35.8% |
| Yakama | 0.0 /100 | #327 | Tragic 36.4% |