Immigrants from Uzbekistan vs Iroquois Single Mother Poverty
COMPARE
Immigrants from Uzbekistan
Iroquois
Single Mother Poverty
Single Mother Poverty Comparison
Immigrants from Uzbekistan
Iroquois
29.3%
SINGLE MOTHER POVERTY
42.6/ 100
METRIC RATING
179th/ 347
METRIC RANK
34.8%
SINGLE MOTHER POVERTY
0.0/ 100
METRIC RATING
320th/ 347
METRIC RANK
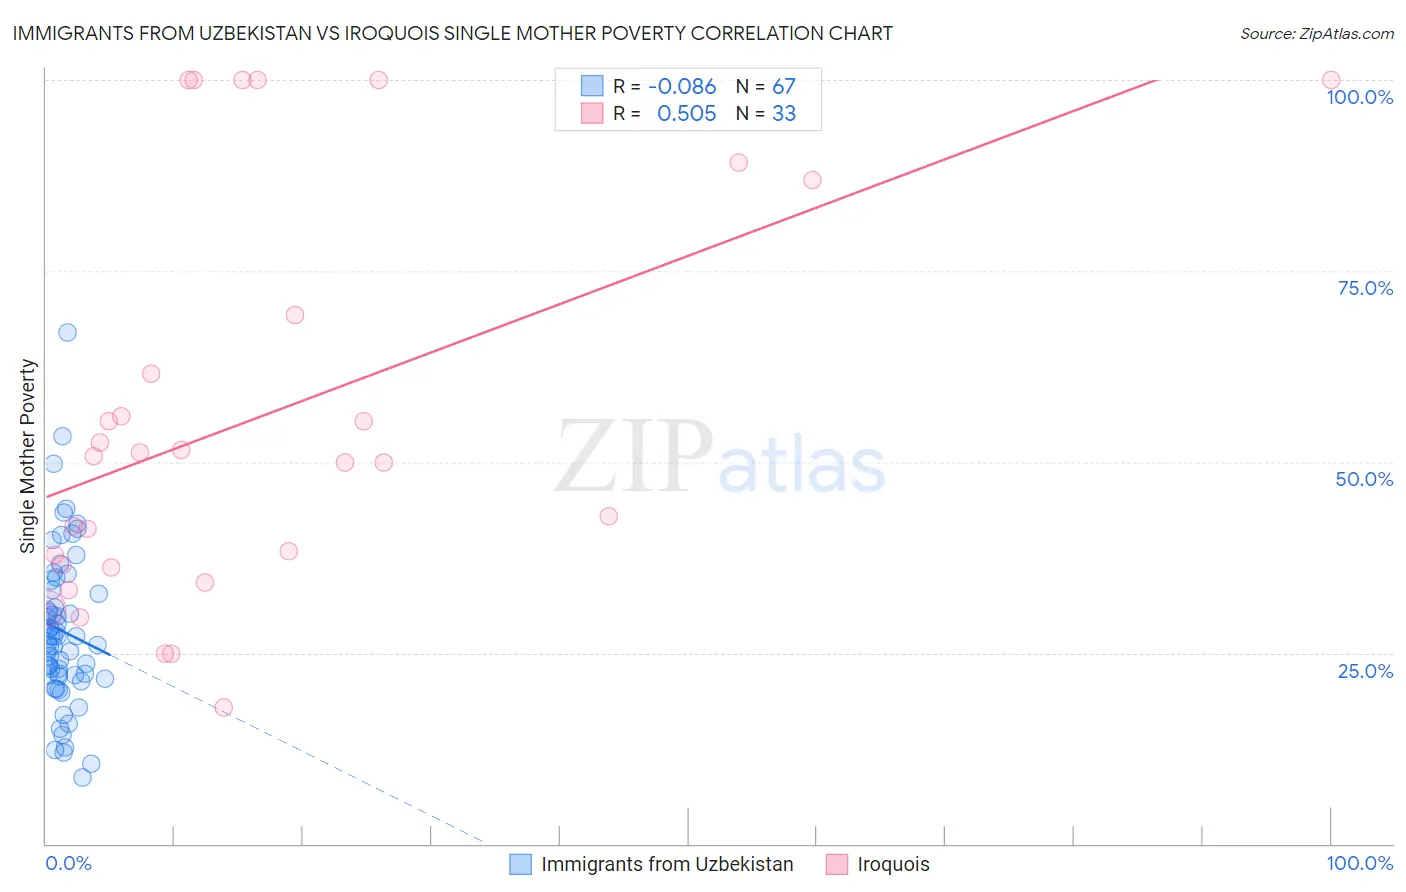
Immigrants from Uzbekistan vs Iroquois Single Mother Poverty Correlation Chart
The statistical analysis conducted on geographies consisting of 117,476,483 people shows a slight negative correlation between the proportion of Immigrants from Uzbekistan and poverty level among single mothers in the United States with a correlation coefficient (R) of -0.086 and weighted average of 29.3%. Similarly, the statistical analysis conducted on geographies consisting of 204,844,819 people shows a substantial positive correlation between the proportion of Iroquois and poverty level among single mothers in the United States with a correlation coefficient (R) of 0.505 and weighted average of 34.8%, a difference of 19.0%.
Single Mother Poverty Correlation Summary
| Measurement | Immigrants from Uzbekistan | Iroquois |
| Minimum | 8.7% | 17.9% |
| Maximum | 67.0% | 100.0% |
| Range | 58.3% | 82.1% |
| Mean | 27.8% | 56.0% |
| Median | 26.3% | 50.8% |
| Interquartile 25% (IQ1) | 21.9% | 36.4% |
| Interquartile 75% (IQ3) | 33.2% | 78.1% |
| Interquartile Range (IQR) | 11.3% | 41.7% |
| Standard Deviation (Sample) | 10.5% | 26.1% |
| Standard Deviation (Population) | 10.4% | 25.7% |
Similar Demographics by Single Mother Poverty
Demographics Similar to Immigrants from Uzbekistan by Single Mother Poverty
In terms of single mother poverty, the demographic groups most similar to Immigrants from Uzbekistan are South American Indian (29.3%, a difference of 0.030%), Immigrants from Norway (29.3%, a difference of 0.050%), Canadian (29.3%, a difference of 0.11%), Immigrants from Bosnia and Herzegovina (29.2%, a difference of 0.12%), and Immigrants from Eastern Africa (29.3%, a difference of 0.20%).
| Demographics | Rating | Rank | Single Mother Poverty |
| Carpatho Rusyns | 53.8 /100 | #172 | Average 29.1% |
| British | 50.6 /100 | #173 | Average 29.2% |
| Immigrants | Saudi Arabia | 50.0 /100 | #174 | Average 29.2% |
| Immigrants | Costa Rica | 48.8 /100 | #175 | Average 29.2% |
| Hawaiians | 47.8 /100 | #176 | Average 29.2% |
| Immigrants | Bosnia and Herzegovina | 45.1 /100 | #177 | Average 29.2% |
| South American Indians | 43.2 /100 | #178 | Average 29.3% |
| Immigrants | Uzbekistan | 42.6 /100 | #179 | Average 29.3% |
| Immigrants | Norway | 41.5 /100 | #180 | Average 29.3% |
| Canadians | 40.4 /100 | #181 | Average 29.3% |
| Immigrants | Eastern Africa | 38.5 /100 | #182 | Fair 29.3% |
| Nepalese | 38.3 /100 | #183 | Fair 29.3% |
| Nigerians | 38.0 /100 | #184 | Fair 29.3% |
| Ghanaians | 36.8 /100 | #185 | Fair 29.4% |
| Yugoslavians | 36.0 /100 | #186 | Fair 29.4% |
Demographics Similar to Iroquois by Single Mother Poverty
In terms of single mother poverty, the demographic groups most similar to Iroquois are Chippewa (34.8%, a difference of 0.24%), Immigrants from Honduras (34.7%, a difference of 0.39%), Paiute (35.1%, a difference of 0.87%), Cherokee (34.5%, a difference of 0.91%), and Dominican (34.5%, a difference of 1.0%).
| Demographics | Rating | Rank | Single Mother Poverty |
| Immigrants | Dominican Republic | 0.0 /100 | #313 | Tragic 34.4% |
| Chickasaw | 0.0 /100 | #314 | Tragic 34.4% |
| Hopi | 0.0 /100 | #315 | Tragic 34.5% |
| Dominicans | 0.0 /100 | #316 | Tragic 34.5% |
| Cherokee | 0.0 /100 | #317 | Tragic 34.5% |
| Immigrants | Honduras | 0.0 /100 | #318 | Tragic 34.7% |
| Chippewa | 0.0 /100 | #319 | Tragic 34.8% |
| Iroquois | 0.0 /100 | #320 | Tragic 34.8% |
| Paiute | 0.0 /100 | #321 | Tragic 35.1% |
| Blacks/African Americans | 0.0 /100 | #322 | Tragic 35.2% |
| Kiowa | 0.0 /100 | #323 | Tragic 35.5% |
| Ottawa | 0.0 /100 | #324 | Tragic 35.5% |
| Ute | 0.0 /100 | #325 | Tragic 35.7% |
| Seminole | 0.0 /100 | #326 | Tragic 35.8% |
| Yakama | 0.0 /100 | #327 | Tragic 36.4% |