Costa Rican vs Iroquois Births to Unmarried Women
COMPARE
Costa Rican
Iroquois
Births to Unmarried Women
Births to Unmarried Women Comparison
Costa Ricans
Iroquois
32.7%
BIRTHS TO UNMARRIED WOMEN
20.3/ 100
METRIC RATING
198th/ 347
METRIC RANK
38.2%
BIRTHS TO UNMARRIED WOMEN
0.0/ 100
METRIC RATING
295th/ 347
METRIC RANK
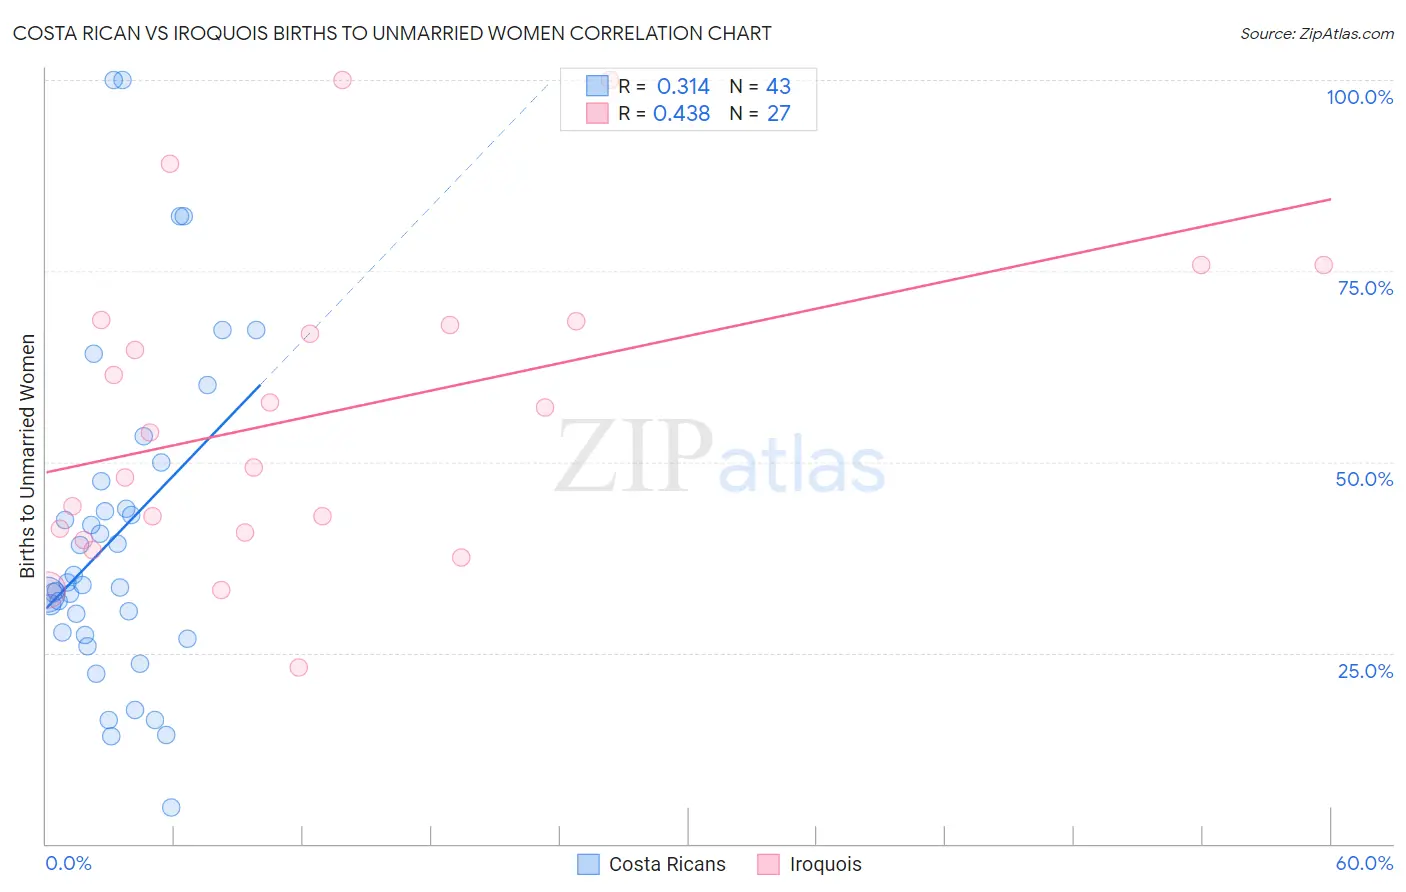
Costa Rican vs Iroquois Births to Unmarried Women Correlation Chart
The statistical analysis conducted on geographies consisting of 243,618,809 people shows a mild positive correlation between the proportion of Costa Ricans and percentage of births to unmarried women in the United States with a correlation coefficient (R) of 0.314 and weighted average of 32.7%. Similarly, the statistical analysis conducted on geographies consisting of 199,233,897 people shows a moderate positive correlation between the proportion of Iroquois and percentage of births to unmarried women in the United States with a correlation coefficient (R) of 0.438 and weighted average of 38.2%, a difference of 16.8%.
Births to Unmarried Women Correlation Summary
| Measurement | Costa Rican | Iroquois |
| Minimum | 4.8% | 23.1% |
| Maximum | 100.0% | 100.0% |
| Range | 95.2% | 76.9% |
| Mean | 40.4% | 56.3% |
| Median | 33.9% | 53.8% |
| Interquartile 25% (IQ1) | 27.3% | 40.8% |
| Interquartile 75% (IQ3) | 47.4% | 68.4% |
| Interquartile Range (IQR) | 20.1% | 27.6% |
| Standard Deviation (Sample) | 21.7% | 20.1% |
| Standard Deviation (Population) | 21.4% | 19.7% |
Similar Demographics by Births to Unmarried Women
Demographics Similar to Costa Ricans by Births to Unmarried Women
In terms of births to unmarried women, the demographic groups most similar to Costa Ricans are Immigrants (32.7%, a difference of 0.050%), Immigrants from Colombia (32.6%, a difference of 0.20%), Immigrants from Thailand (32.8%, a difference of 0.20%), Immigrants from Germany (32.8%, a difference of 0.22%), and Samoan (32.6%, a difference of 0.23%).
| Demographics | Rating | Rank | Births to Unmarried Women |
| Irish | 32.4 /100 | #191 | Fair 32.2% |
| Colombians | 31.9 /100 | #192 | Fair 32.2% |
| Fijians | 31.1 /100 | #193 | Fair 32.3% |
| Sudanese | 27.3 /100 | #194 | Fair 32.4% |
| Samoans | 21.9 /100 | #195 | Fair 32.6% |
| Immigrants | Colombia | 21.7 /100 | #196 | Fair 32.6% |
| Immigrants | Immigrants | 20.6 /100 | #197 | Fair 32.7% |
| Costa Ricans | 20.3 /100 | #198 | Fair 32.7% |
| Immigrants | Thailand | 18.9 /100 | #199 | Poor 32.8% |
| Immigrants | Germany | 18.8 /100 | #200 | Poor 32.8% |
| Immigrants | Burma/Myanmar | 16.7 /100 | #201 | Poor 32.9% |
| Immigrants | Micronesia | 16.6 /100 | #202 | Poor 32.9% |
| Ute | 14.4 /100 | #203 | Poor 33.0% |
| Immigrants | Africa | 14.3 /100 | #204 | Poor 33.0% |
| German Russians | 13.1 /100 | #205 | Poor 33.1% |
Demographics Similar to Iroquois by Births to Unmarried Women
In terms of births to unmarried women, the demographic groups most similar to Iroquois are Alaska Native (38.3%, a difference of 0.24%), Dutch West Indian (38.4%, a difference of 0.52%), British West Indian (38.0%, a difference of 0.55%), Immigrants from Nicaragua (38.0%, a difference of 0.60%), and Jamaican (38.5%, a difference of 0.72%).
| Demographics | Rating | Rank | Births to Unmarried Women |
| Immigrants | Liberia | 0.0 /100 | #288 | Tragic 37.6% |
| Alaskan Athabascans | 0.0 /100 | #289 | Tragic 37.7% |
| Hispanics or Latinos | 0.0 /100 | #290 | Tragic 37.8% |
| Seminole | 0.0 /100 | #291 | Tragic 37.9% |
| Blackfeet | 0.0 /100 | #292 | Tragic 37.9% |
| Immigrants | Nicaragua | 0.0 /100 | #293 | Tragic 38.0% |
| British West Indians | 0.0 /100 | #294 | Tragic 38.0% |
| Iroquois | 0.0 /100 | #295 | Tragic 38.2% |
| Alaska Natives | 0.0 /100 | #296 | Tragic 38.3% |
| Dutch West Indians | 0.0 /100 | #297 | Tragic 38.4% |
| Jamaicans | 0.0 /100 | #298 | Tragic 38.5% |
| Spanish Americans | 0.0 /100 | #299 | Tragic 38.6% |
| Immigrants | West Indies | 0.0 /100 | #300 | Tragic 38.6% |
| Haitians | 0.0 /100 | #301 | Tragic 38.6% |
| Hondurans | 0.0 /100 | #302 | Tragic 38.7% |