Bangladeshi vs Russian Single Father Poverty
COMPARE
Bangladeshi
Russian
Single Father Poverty
Single Father Poverty Comparison
Bangladeshis
Russians
15.2%
SINGLE FATHER POVERTY
99.8/ 100
METRIC RATING
64th/ 347
METRIC RANK
16.4%
SINGLE FATHER POVERTY
30.1/ 100
METRIC RATING
188th/ 347
METRIC RANK
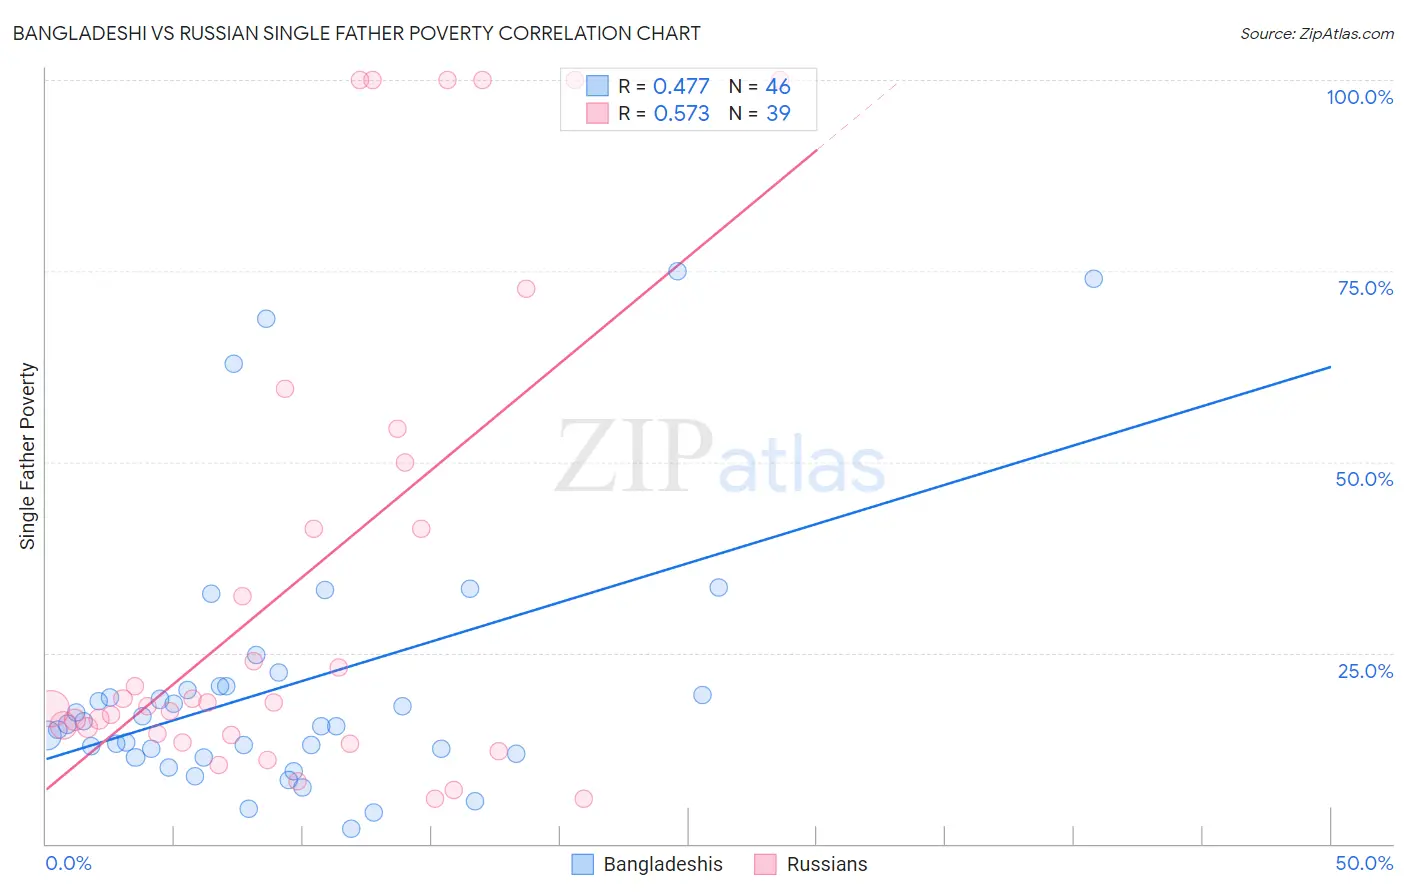
Bangladeshi vs Russian Single Father Poverty Correlation Chart
The statistical analysis conducted on geographies consisting of 125,568,753 people shows a moderate positive correlation between the proportion of Bangladeshis and poverty level among single fathers in the United States with a correlation coefficient (R) of 0.477 and weighted average of 15.2%. Similarly, the statistical analysis conducted on geographies consisting of 378,661,966 people shows a substantial positive correlation between the proportion of Russians and poverty level among single fathers in the United States with a correlation coefficient (R) of 0.573 and weighted average of 16.4%, a difference of 8.3%.
Single Father Poverty Correlation Summary
| Measurement | Bangladeshi | Russian |
| Minimum | 2.0% | 5.9% |
| Maximum | 75.0% | 100.0% |
| Range | 73.0% | 94.1% |
| Mean | 20.5% | 34.4% |
| Median | 15.5% | 18.4% |
| Interquartile 25% (IQ1) | 11.7% | 14.2% |
| Interquartile 75% (IQ3) | 20.6% | 50.0% |
| Interquartile Range (IQR) | 8.8% | 35.8% |
| Standard Deviation (Sample) | 17.2% | 32.0% |
| Standard Deviation (Population) | 17.0% | 31.6% |
Similar Demographics by Single Father Poverty
Demographics Similar to Bangladeshis by Single Father Poverty
In terms of single father poverty, the demographic groups most similar to Bangladeshis are Immigrants from Sweden (15.2%, a difference of 0.080%), Immigrants from Malaysia (15.2%, a difference of 0.090%), Immigrants from Moldova (15.2%, a difference of 0.11%), Immigrants from Armenia (15.2%, a difference of 0.17%), and Immigrants from Bosnia and Herzegovina (15.2%, a difference of 0.18%).
| Demographics | Rating | Rank | Single Father Poverty |
| Laotians | 99.9 /100 | #57 | Exceptional 15.1% |
| Hawaiians | 99.9 /100 | #58 | Exceptional 15.1% |
| Guamanians/Chamorros | 99.9 /100 | #59 | Exceptional 15.1% |
| Puget Sound Salish | 99.8 /100 | #60 | Exceptional 15.2% |
| Immigrants | Bosnia and Herzegovina | 99.8 /100 | #61 | Exceptional 15.2% |
| Immigrants | Armenia | 99.8 /100 | #62 | Exceptional 15.2% |
| Immigrants | Sweden | 99.8 /100 | #63 | Exceptional 15.2% |
| Bangladeshis | 99.8 /100 | #64 | Exceptional 15.2% |
| Immigrants | Malaysia | 99.8 /100 | #65 | Exceptional 15.2% |
| Immigrants | Moldova | 99.8 /100 | #66 | Exceptional 15.2% |
| Paraguayans | 99.7 /100 | #67 | Exceptional 15.2% |
| Immigrants | Cameroon | 99.7 /100 | #68 | Exceptional 15.2% |
| Japanese | 99.7 /100 | #69 | Exceptional 15.2% |
| Mongolians | 99.7 /100 | #70 | Exceptional 15.3% |
| Immigrants | Brazil | 99.6 /100 | #71 | Exceptional 15.3% |
Demographics Similar to Russians by Single Father Poverty
In terms of single father poverty, the demographic groups most similar to Russians are Ukrainian (16.4%, a difference of 0.020%), Immigrants from Venezuela (16.4%, a difference of 0.050%), Latvian (16.5%, a difference of 0.060%), Immigrants from Burma/Myanmar (16.5%, a difference of 0.11%), and Immigrants from Guyana (16.5%, a difference of 0.16%).
| Demographics | Rating | Rank | Single Father Poverty |
| Immigrants | Western Africa | 36.0 /100 | #181 | Fair 16.4% |
| Immigrants | Italy | 35.7 /100 | #182 | Fair 16.4% |
| Aleuts | 35.3 /100 | #183 | Fair 16.4% |
| Cambodians | 34.6 /100 | #184 | Fair 16.4% |
| Panamanians | 33.6 /100 | #185 | Fair 16.4% |
| Immigrants | Venezuela | 31.0 /100 | #186 | Fair 16.4% |
| Ukrainians | 30.4 /100 | #187 | Fair 16.4% |
| Russians | 30.1 /100 | #188 | Fair 16.4% |
| Latvians | 28.9 /100 | #189 | Fair 16.5% |
| Immigrants | Burma/Myanmar | 28.0 /100 | #190 | Fair 16.5% |
| Immigrants | Guyana | 27.1 /100 | #191 | Fair 16.5% |
| Immigrants | Switzerland | 24.8 /100 | #192 | Fair 16.5% |
| Ecuadorians | 24.5 /100 | #193 | Fair 16.5% |
| Cape Verdeans | 24.4 /100 | #194 | Fair 16.5% |
| Immigrants | Barbados | 24.3 /100 | #195 | Fair 16.5% |