Immigrants from Europe vs Immigrants from Western Africa Single Father Poverty
COMPARE
Immigrants from Europe
Immigrants from Western Africa
Single Father Poverty
Single Father Poverty Comparison
Immigrants from Europe
Immigrants from Western Africa
16.3%
SINGLE FATHER POVERTY
54.8/ 100
METRIC RATING
166th/ 347
METRIC RANK
16.4%
SINGLE FATHER POVERTY
36.0/ 100
METRIC RATING
181st/ 347
METRIC RANK
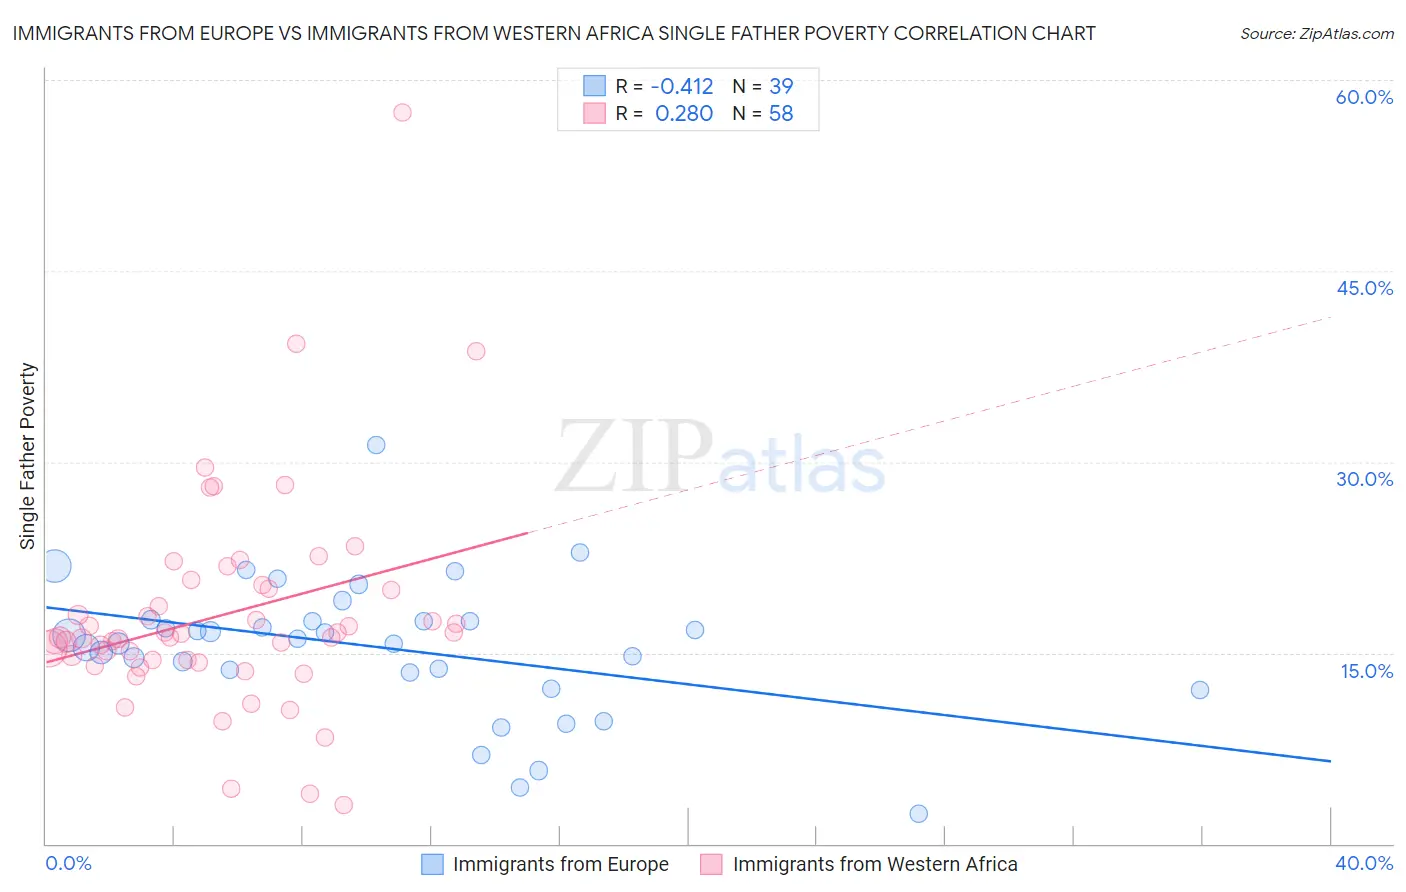
Immigrants from Europe vs Immigrants from Western Africa Single Father Poverty Correlation Chart
The statistical analysis conducted on geographies consisting of 399,898,147 people shows a moderate negative correlation between the proportion of Immigrants from Europe and poverty level among single fathers in the United States with a correlation coefficient (R) of -0.412 and weighted average of 16.3%. Similarly, the statistical analysis conducted on geographies consisting of 289,916,705 people shows a weak positive correlation between the proportion of Immigrants from Western Africa and poverty level among single fathers in the United States with a correlation coefficient (R) of 0.280 and weighted average of 16.4%, a difference of 0.85%.
Single Father Poverty Correlation Summary
| Measurement | Immigrants from Europe | Immigrants from Western Africa |
| Minimum | 2.4% | 3.1% |
| Maximum | 31.4% | 57.4% |
| Range | 29.0% | 54.4% |
| Mean | 15.4% | 18.0% |
| Median | 16.1% | 16.2% |
| Interquartile 25% (IQ1) | 13.5% | 14.4% |
| Interquartile 75% (IQ3) | 17.5% | 20.0% |
| Interquartile Range (IQR) | 4.0% | 5.5% |
| Standard Deviation (Sample) | 5.4% | 8.5% |
| Standard Deviation (Population) | 5.4% | 8.5% |
Demographics Similar to Immigrants from Europe and Immigrants from Western Africa by Single Father Poverty
In terms of single father poverty, the demographic groups most similar to Immigrants from Europe are Guyanese (16.3%, a difference of 0.010%), Immigrants from Bangladesh (16.3%, a difference of 0.010%), Immigrants from Costa Rica (16.3%, a difference of 0.040%), Yugoslavian (16.3%, a difference of 0.040%), and Costa Rican (16.3%, a difference of 0.050%). Similarly, the demographic groups most similar to Immigrants from Western Africa are Immigrants from Italy (16.4%, a difference of 0.010%), Aleut (16.4%, a difference of 0.030%), Immigrants from Latin America (16.4%, a difference of 0.060%), Serbian (16.4%, a difference of 0.23%), and Immigrants from Cuba (16.4%, a difference of 0.26%).
| Demographics | Rating | Rank | Single Father Poverty |
| Immigrants | Costa Rica | 55.7 /100 | #163 | Average 16.3% |
| Guyanese | 55.2 /100 | #164 | Average 16.3% |
| Immigrants | Bangladesh | 55.1 /100 | #165 | Average 16.3% |
| Immigrants | Europe | 54.8 /100 | #166 | Average 16.3% |
| Yugoslavians | 53.9 /100 | #167 | Average 16.3% |
| Costa Ricans | 53.6 /100 | #168 | Average 16.3% |
| Northern Europeans | 52.8 /100 | #169 | Average 16.3% |
| Scandinavians | 52.3 /100 | #170 | Average 16.3% |
| Immigrants | Morocco | 50.7 /100 | #171 | Average 16.3% |
| Immigrants | Sierra Leone | 50.1 /100 | #172 | Average 16.3% |
| Immigrants | St. Vincent and the Grenadines | 50.0 /100 | #173 | Average 16.3% |
| Swedes | 50.0 /100 | #174 | Average 16.3% |
| Immigrants | Ecuador | 49.7 /100 | #175 | Average 16.3% |
| Vietnamese | 48.0 /100 | #176 | Average 16.3% |
| Immigrants | South Africa | 44.2 /100 | #177 | Average 16.3% |
| Immigrants | Cuba | 41.6 /100 | #178 | Average 16.4% |
| Serbians | 40.9 /100 | #179 | Average 16.4% |
| Immigrants | Latin America | 37.2 /100 | #180 | Fair 16.4% |
| Immigrants | Western Africa | 36.0 /100 | #181 | Fair 16.4% |
| Immigrants | Italy | 35.7 /100 | #182 | Fair 16.4% |
| Aleuts | 35.3 /100 | #183 | Fair 16.4% |