Immigrants from Malaysia vs Immigrants from Western Africa Single Father Poverty
COMPARE
Immigrants from Malaysia
Immigrants from Western Africa
Single Father Poverty
Single Father Poverty Comparison
Immigrants from Malaysia
Immigrants from Western Africa
15.2%
SINGLE FATHER POVERTY
99.8/ 100
METRIC RATING
65th/ 347
METRIC RANK
16.4%
SINGLE FATHER POVERTY
36.0/ 100
METRIC RATING
181st/ 347
METRIC RANK
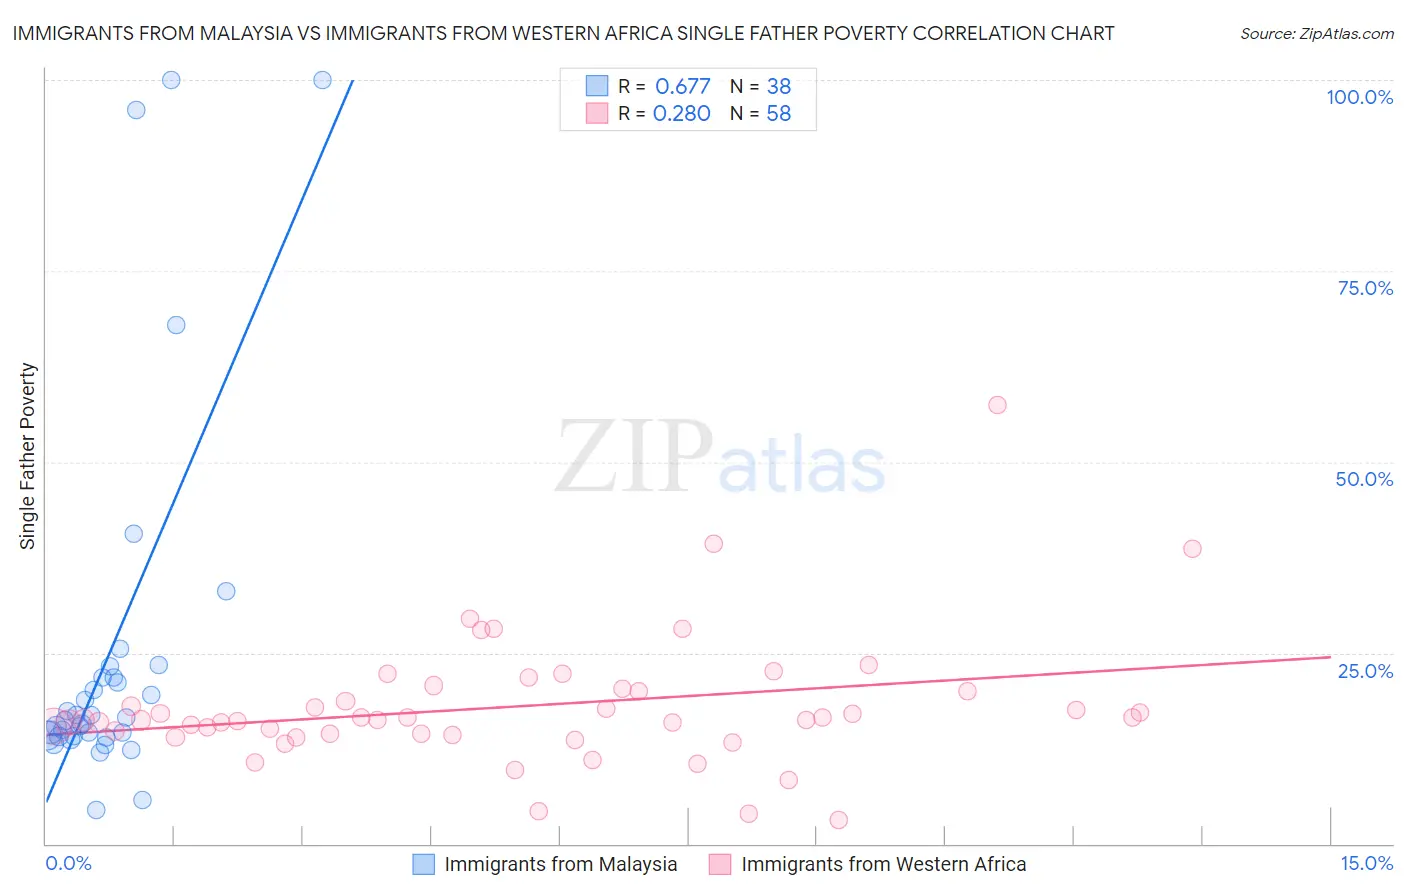
Immigrants from Malaysia vs Immigrants from Western Africa Single Father Poverty Correlation Chart
The statistical analysis conducted on geographies consisting of 167,066,405 people shows a significant positive correlation between the proportion of Immigrants from Malaysia and poverty level among single fathers in the United States with a correlation coefficient (R) of 0.677 and weighted average of 15.2%. Similarly, the statistical analysis conducted on geographies consisting of 289,916,705 people shows a weak positive correlation between the proportion of Immigrants from Western Africa and poverty level among single fathers in the United States with a correlation coefficient (R) of 0.280 and weighted average of 16.4%, a difference of 7.9%.
Single Father Poverty Correlation Summary
| Measurement | Immigrants from Malaysia | Immigrants from Western Africa |
| Minimum | 4.4% | 3.1% |
| Maximum | 100.0% | 57.4% |
| Range | 95.6% | 54.4% |
| Mean | 25.0% | 18.0% |
| Median | 16.4% | 16.2% |
| Interquartile 25% (IQ1) | 14.2% | 14.4% |
| Interquartile 75% (IQ3) | 21.7% | 20.0% |
| Interquartile Range (IQR) | 7.6% | 5.5% |
| Standard Deviation (Sample) | 24.2% | 8.5% |
| Standard Deviation (Population) | 23.9% | 8.5% |
Similar Demographics by Single Father Poverty
Demographics Similar to Immigrants from Malaysia by Single Father Poverty
In terms of single father poverty, the demographic groups most similar to Immigrants from Malaysia are Immigrants from Moldova (15.2%, a difference of 0.020%), Bangladeshi (15.2%, a difference of 0.090%), Paraguayan (15.2%, a difference of 0.11%), Immigrants from Sweden (15.2%, a difference of 0.16%), and Immigrants from Cameroon (15.2%, a difference of 0.20%).
| Demographics | Rating | Rank | Single Father Poverty |
| Hawaiians | 99.9 /100 | #58 | Exceptional 15.1% |
| Guamanians/Chamorros | 99.9 /100 | #59 | Exceptional 15.1% |
| Puget Sound Salish | 99.8 /100 | #60 | Exceptional 15.2% |
| Immigrants | Bosnia and Herzegovina | 99.8 /100 | #61 | Exceptional 15.2% |
| Immigrants | Armenia | 99.8 /100 | #62 | Exceptional 15.2% |
| Immigrants | Sweden | 99.8 /100 | #63 | Exceptional 15.2% |
| Bangladeshis | 99.8 /100 | #64 | Exceptional 15.2% |
| Immigrants | Malaysia | 99.8 /100 | #65 | Exceptional 15.2% |
| Immigrants | Moldova | 99.8 /100 | #66 | Exceptional 15.2% |
| Paraguayans | 99.7 /100 | #67 | Exceptional 15.2% |
| Immigrants | Cameroon | 99.7 /100 | #68 | Exceptional 15.2% |
| Japanese | 99.7 /100 | #69 | Exceptional 15.2% |
| Mongolians | 99.7 /100 | #70 | Exceptional 15.3% |
| Immigrants | Brazil | 99.6 /100 | #71 | Exceptional 15.3% |
| Immigrants | Lithuania | 99.6 /100 | #72 | Exceptional 15.3% |
Demographics Similar to Immigrants from Western Africa by Single Father Poverty
In terms of single father poverty, the demographic groups most similar to Immigrants from Western Africa are Immigrants from Italy (16.4%, a difference of 0.010%), Aleut (16.4%, a difference of 0.030%), Immigrants from Latin America (16.4%, a difference of 0.060%), Cambodian (16.4%, a difference of 0.060%), and Panamanian (16.4%, a difference of 0.12%).
| Demographics | Rating | Rank | Single Father Poverty |
| Swedes | 50.0 /100 | #174 | Average 16.3% |
| Immigrants | Ecuador | 49.7 /100 | #175 | Average 16.3% |
| Vietnamese | 48.0 /100 | #176 | Average 16.3% |
| Immigrants | South Africa | 44.2 /100 | #177 | Average 16.3% |
| Immigrants | Cuba | 41.6 /100 | #178 | Average 16.4% |
| Serbians | 40.9 /100 | #179 | Average 16.4% |
| Immigrants | Latin America | 37.2 /100 | #180 | Fair 16.4% |
| Immigrants | Western Africa | 36.0 /100 | #181 | Fair 16.4% |
| Immigrants | Italy | 35.7 /100 | #182 | Fair 16.4% |
| Aleuts | 35.3 /100 | #183 | Fair 16.4% |
| Cambodians | 34.6 /100 | #184 | Fair 16.4% |
| Panamanians | 33.6 /100 | #185 | Fair 16.4% |
| Immigrants | Venezuela | 31.0 /100 | #186 | Fair 16.4% |
| Ukrainians | 30.4 /100 | #187 | Fair 16.4% |
| Russians | 30.1 /100 | #188 | Fair 16.4% |