Colombian vs English Single Mother Poverty
COMPARE
Colombian
English
Single Mother Poverty
Single Mother Poverty Comparison
Colombians
English
28.3%
SINGLE MOTHER POVERTY
91.8/ 100
METRIC RATING
122nd/ 347
METRIC RANK
30.2%
SINGLE MOTHER POVERTY
4.8/ 100
METRIC RATING
230th/ 347
METRIC RANK
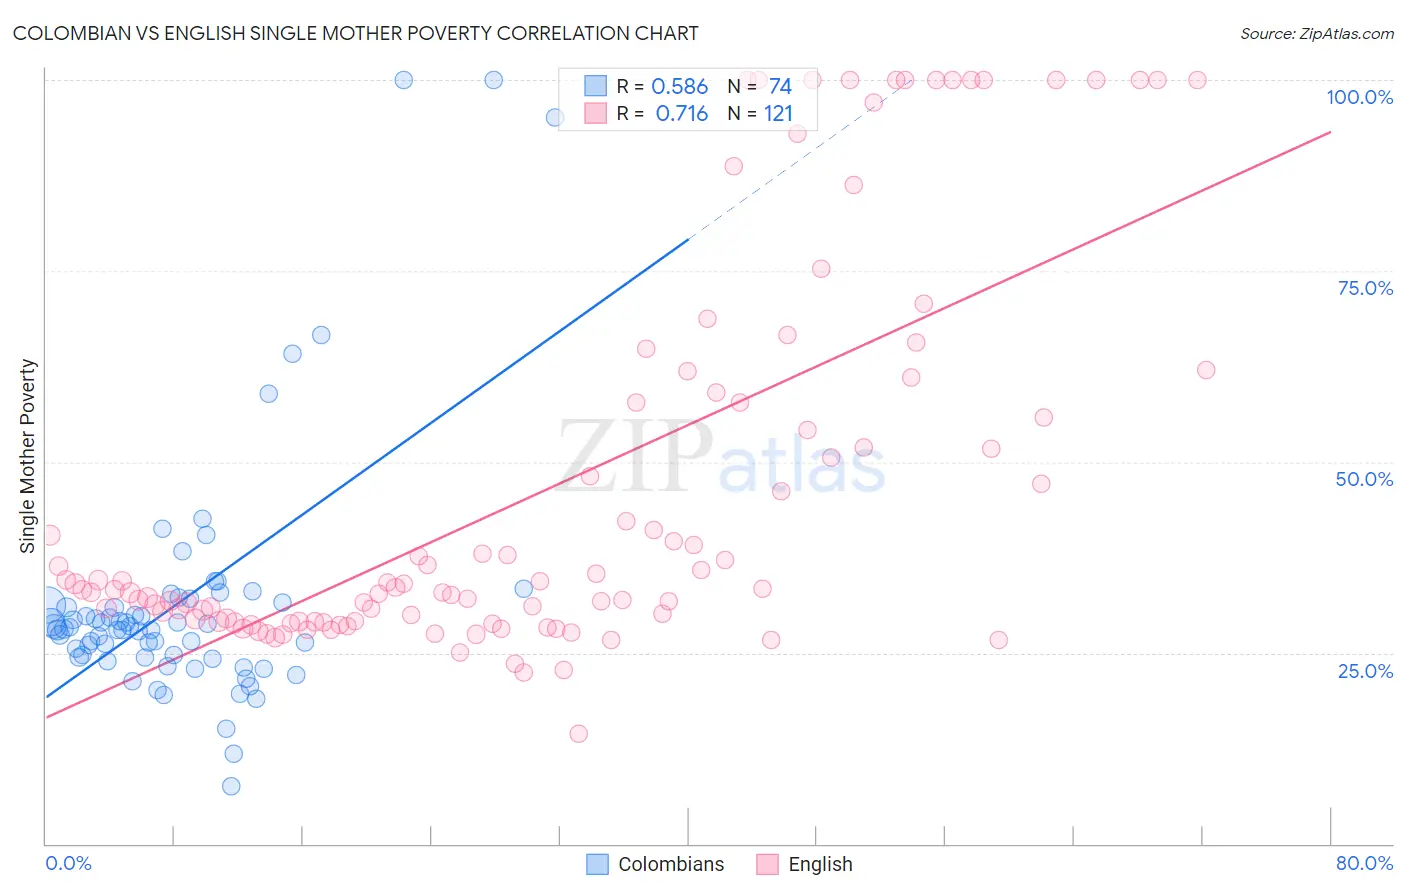
Colombian vs English Single Mother Poverty Correlation Chart
The statistical analysis conducted on geographies consisting of 409,096,293 people shows a substantial positive correlation between the proportion of Colombians and poverty level among single mothers in the United States with a correlation coefficient (R) of 0.586 and weighted average of 28.3%. Similarly, the statistical analysis conducted on geographies consisting of 548,772,059 people shows a strong positive correlation between the proportion of English and poverty level among single mothers in the United States with a correlation coefficient (R) of 0.716 and weighted average of 30.2%, a difference of 6.6%.
Single Mother Poverty Correlation Summary
| Measurement | Colombian | English |
| Minimum | 7.6% | 14.4% |
| Maximum | 100.0% | 100.0% |
| Range | 92.4% | 85.6% |
| Mean | 31.7% | 46.2% |
| Median | 28.2% | 33.3% |
| Interquartile 25% (IQ1) | 24.4% | 29.1% |
| Interquartile 75% (IQ3) | 31.6% | 57.7% |
| Interquartile Range (IQR) | 7.2% | 28.6% |
| Standard Deviation (Sample) | 16.6% | 25.2% |
| Standard Deviation (Population) | 16.5% | 25.1% |
Similar Demographics by Single Mother Poverty
Demographics Similar to Colombians by Single Mother Poverty
In terms of single mother poverty, the demographic groups most similar to Colombians are Uruguayan (28.3%, a difference of 0.010%), Immigrants from Switzerland (28.3%, a difference of 0.010%), Immigrants from Afghanistan (28.3%, a difference of 0.050%), Cypriot (28.3%, a difference of 0.090%), and Immigrants from Syria (28.3%, a difference of 0.10%).
| Demographics | Rating | Rank | Single Mother Poverty |
| Immigrants | Kuwait | 92.7 /100 | #115 | Exceptional 28.3% |
| Immigrants | Uganda | 92.5 /100 | #116 | Exceptional 28.3% |
| Australians | 92.5 /100 | #117 | Exceptional 28.3% |
| Brazilians | 92.4 /100 | #118 | Exceptional 28.3% |
| Immigrants | Syria | 92.4 /100 | #119 | Exceptional 28.3% |
| Cypriots | 92.3 /100 | #120 | Exceptional 28.3% |
| Immigrants | Afghanistan | 92.1 /100 | #121 | Exceptional 28.3% |
| Colombians | 91.8 /100 | #122 | Exceptional 28.3% |
| Uruguayans | 91.7 /100 | #123 | Exceptional 28.3% |
| Immigrants | Switzerland | 91.7 /100 | #124 | Exceptional 28.3% |
| Kenyans | 90.9 /100 | #125 | Exceptional 28.4% |
| Immigrants | Chile | 90.8 /100 | #126 | Exceptional 28.4% |
| Poles | 90.8 /100 | #127 | Exceptional 28.4% |
| Immigrants | England | 90.5 /100 | #128 | Exceptional 28.4% |
| South Americans | 90.4 /100 | #129 | Exceptional 28.4% |
Demographics Similar to English by Single Mother Poverty
In terms of single mother poverty, the demographic groups most similar to English are Immigrants from Barbados (30.2%, a difference of 0.040%), Spaniard (30.2%, a difference of 0.13%), Dutch (30.2%, a difference of 0.15%), Alaskan Athabascan (30.3%, a difference of 0.19%), and Immigrants from Liberia (30.1%, a difference of 0.25%).
| Demographics | Rating | Rank | Single Mother Poverty |
| Immigrants | Cuba | 6.9 /100 | #223 | Tragic 30.1% |
| Immigrants | Sudan | 6.5 /100 | #224 | Tragic 30.1% |
| Spanish | 6.3 /100 | #225 | Tragic 30.1% |
| Scottish | 6.0 /100 | #226 | Tragic 30.1% |
| Immigrants | Liberia | 5.9 /100 | #227 | Tragic 30.1% |
| Spaniards | 5.4 /100 | #228 | Tragic 30.2% |
| Immigrants | Barbados | 5.0 /100 | #229 | Tragic 30.2% |
| English | 4.8 /100 | #230 | Tragic 30.2% |
| Dutch | 4.3 /100 | #231 | Tragic 30.2% |
| Alaskan Athabascans | 4.1 /100 | #232 | Tragic 30.3% |
| Immigrants | Middle Africa | 3.5 /100 | #233 | Tragic 30.3% |
| Immigrants | Nicaragua | 3.5 /100 | #234 | Tragic 30.3% |
| Immigrants | Grenada | 3.4 /100 | #235 | Tragic 30.3% |
| Welsh | 3.2 /100 | #236 | Tragic 30.4% |
| Immigrants | St. Vincent and the Grenadines | 3.1 /100 | #237 | Tragic 30.4% |