Choctaw vs Jordanian Single Mother Poverty
COMPARE
Choctaw
Jordanian
Single Mother Poverty
Single Mother Poverty Comparison
Choctaw
Jordanians
36.4%
SINGLE MOTHER POVERTY
0.0/ 100
METRIC RATING
328th/ 347
METRIC RANK
26.4%
SINGLE MOTHER POVERTY
100.0/ 100
METRIC RATING
29th/ 347
METRIC RANK
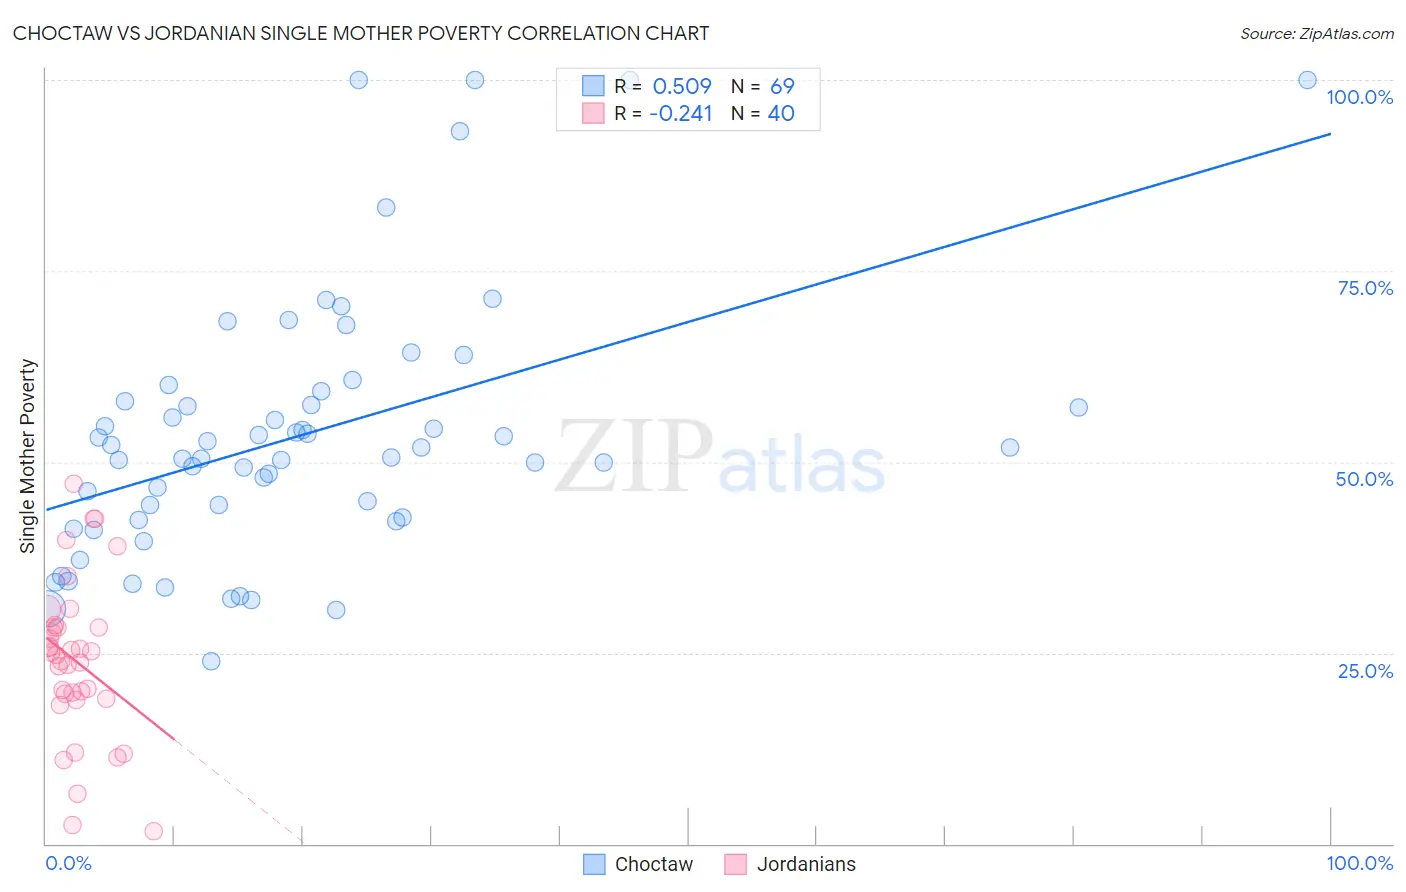
Choctaw vs Jordanian Single Mother Poverty Correlation Chart
The statistical analysis conducted on geographies consisting of 266,090,747 people shows a substantial positive correlation between the proportion of Choctaw and poverty level among single mothers in the United States with a correlation coefficient (R) of 0.509 and weighted average of 36.4%. Similarly, the statistical analysis conducted on geographies consisting of 164,762,978 people shows a weak negative correlation between the proportion of Jordanians and poverty level among single mothers in the United States with a correlation coefficient (R) of -0.241 and weighted average of 26.4%, a difference of 37.9%.
Single Mother Poverty Correlation Summary
| Measurement | Choctaw | Jordanian |
| Minimum | 24.0% | 1.7% |
| Maximum | 100.0% | 47.1% |
| Range | 76.0% | 45.4% |
| Mean | 53.6% | 24.0% |
| Median | 51.8% | 24.9% |
| Interquartile 25% (IQ1) | 42.5% | 19.3% |
| Interquartile 75% (IQ3) | 58.6% | 28.3% |
| Interquartile Range (IQR) | 16.1% | 9.0% |
| Standard Deviation (Sample) | 17.1% | 10.2% |
| Standard Deviation (Population) | 17.0% | 10.1% |
Similar Demographics by Single Mother Poverty
Demographics Similar to Choctaw by Single Mother Poverty
In terms of single mother poverty, the demographic groups most similar to Choctaw are Yakama (36.4%, a difference of 0.060%), Apache (36.6%, a difference of 0.48%), Native/Alaskan (36.6%, a difference of 0.58%), Creek (36.7%, a difference of 0.74%), and Dutch West Indian (36.8%, a difference of 0.98%).
| Demographics | Rating | Rank | Single Mother Poverty |
| Paiute | 0.0 /100 | #321 | Tragic 35.1% |
| Blacks/African Americans | 0.0 /100 | #322 | Tragic 35.2% |
| Kiowa | 0.0 /100 | #323 | Tragic 35.5% |
| Ottawa | 0.0 /100 | #324 | Tragic 35.5% |
| Ute | 0.0 /100 | #325 | Tragic 35.7% |
| Seminole | 0.0 /100 | #326 | Tragic 35.8% |
| Yakama | 0.0 /100 | #327 | Tragic 36.4% |
| Choctaw | 0.0 /100 | #328 | Tragic 36.4% |
| Apache | 0.0 /100 | #329 | Tragic 36.6% |
| Natives/Alaskans | 0.0 /100 | #330 | Tragic 36.6% |
| Creek | 0.0 /100 | #331 | Tragic 36.7% |
| Dutch West Indians | 0.0 /100 | #332 | Tragic 36.8% |
| Menominee | 0.0 /100 | #333 | Tragic 37.1% |
| Pueblo | 0.0 /100 | #334 | Tragic 37.2% |
| Yuman | 0.0 /100 | #335 | Tragic 37.8% |
Demographics Similar to Jordanians by Single Mother Poverty
In terms of single mother poverty, the demographic groups most similar to Jordanians are Korean (26.4%, a difference of 0.050%), Immigrants from Japan (26.4%, a difference of 0.070%), Turkish (26.4%, a difference of 0.090%), Immigrants from Philippines (26.5%, a difference of 0.24%), and Immigrants from Sri Lanka (26.3%, a difference of 0.29%).
| Demographics | Rating | Rank | Single Mother Poverty |
| Immigrants | Korea | 100.0 /100 | #22 | Exceptional 26.2% |
| Burmese | 100.0 /100 | #23 | Exceptional 26.2% |
| Immigrants | Moldova | 100.0 /100 | #24 | Exceptional 26.2% |
| Immigrants | Asia | 100.0 /100 | #25 | Exceptional 26.3% |
| Immigrants | Sri Lanka | 100.0 /100 | #26 | Exceptional 26.3% |
| Immigrants | Japan | 100.0 /100 | #27 | Exceptional 26.4% |
| Koreans | 100.0 /100 | #28 | Exceptional 26.4% |
| Jordanians | 100.0 /100 | #29 | Exceptional 26.4% |
| Turks | 100.0 /100 | #30 | Exceptional 26.4% |
| Immigrants | Philippines | 100.0 /100 | #31 | Exceptional 26.5% |
| Tongans | 99.9 /100 | #32 | Exceptional 26.5% |
| Bulgarians | 99.9 /100 | #33 | Exceptional 26.5% |
| Immigrants | Indonesia | 99.9 /100 | #34 | Exceptional 26.6% |
| Maltese | 99.9 /100 | #35 | Exceptional 26.6% |
| Okinawans | 99.9 /100 | #36 | Exceptional 26.6% |