Choctaw vs Latvian In Labor Force | Age 30-34
COMPARE
Choctaw
Latvian
In Labor Force | Age 30-34
In Labor Force | Age 30-34 Comparison
Choctaw
Latvians
81.4%
IN LABOR FORCE | AGE 30-34
0.0/ 100
METRIC RATING
318th/ 347
METRIC RANK
86.0%
IN LABOR FORCE | AGE 30-34
100.0/ 100
METRIC RATING
16th/ 347
METRIC RANK
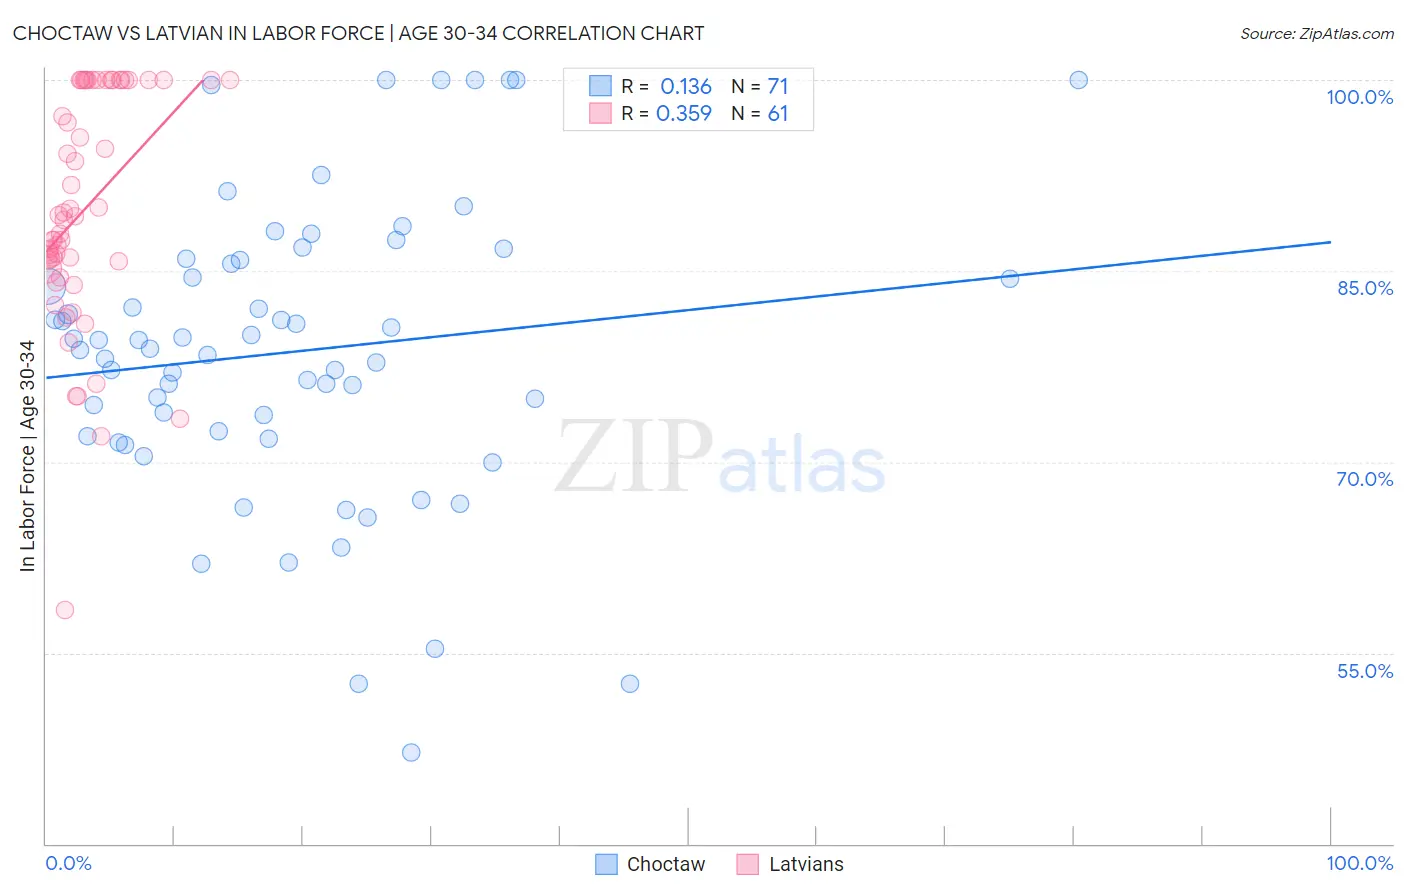
Choctaw vs Latvian In Labor Force | Age 30-34 Correlation Chart
The statistical analysis conducted on geographies consisting of 269,615,470 people shows a poor positive correlation between the proportion of Choctaw and labor force participation rate among population between the ages 30 and 34 in the United States with a correlation coefficient (R) of 0.136 and weighted average of 81.4%. Similarly, the statistical analysis conducted on geographies consisting of 220,645,666 people shows a mild positive correlation between the proportion of Latvians and labor force participation rate among population between the ages 30 and 34 in the United States with a correlation coefficient (R) of 0.359 and weighted average of 86.0%, a difference of 5.7%.
In Labor Force | Age 30-34 Correlation Summary
| Measurement | Choctaw | Latvian |
| Minimum | 47.2% | 58.4% |
| Maximum | 100.0% | 100.0% |
| Range | 52.8% | 41.6% |
| Mean | 78.7% | 90.0% |
| Median | 78.9% | 89.3% |
| Interquartile 25% (IQ1) | 72.0% | 85.5% |
| Interquartile 75% (IQ3) | 85.9% | 100.0% |
| Interquartile Range (IQR) | 13.9% | 14.5% |
| Standard Deviation (Sample) | 11.6% | 9.1% |
| Standard Deviation (Population) | 11.5% | 9.1% |
Similar Demographics by In Labor Force | Age 30-34
Demographics Similar to Choctaw by In Labor Force | Age 30-34
In terms of in labor force | age 30-34, the demographic groups most similar to Choctaw are Shoshone (81.4%, a difference of 0.0%), Yaqui (81.4%, a difference of 0.020%), Immigrants from the Azores (81.5%, a difference of 0.080%), Arapaho (81.5%, a difference of 0.080%), and Alaska Native (81.3%, a difference of 0.10%).
| Demographics | Rating | Rank | In Labor Force | Age 30-34 |
| Chickasaw | 0.0 /100 | #311 | Tragic 81.9% |
| Mexicans | 0.0 /100 | #312 | Tragic 81.9% |
| Iroquois | 0.0 /100 | #313 | Tragic 81.9% |
| Alaskan Athabascans | 0.0 /100 | #314 | Tragic 81.7% |
| Cherokee | 0.0 /100 | #315 | Tragic 81.6% |
| Immigrants | Azores | 0.0 /100 | #316 | Tragic 81.5% |
| Arapaho | 0.0 /100 | #317 | Tragic 81.5% |
| Choctaw | 0.0 /100 | #318 | Tragic 81.4% |
| Shoshone | 0.0 /100 | #319 | Tragic 81.4% |
| Yaqui | 0.0 /100 | #320 | Tragic 81.4% |
| Alaska Natives | 0.0 /100 | #321 | Tragic 81.3% |
| Puerto Ricans | 0.0 /100 | #322 | Tragic 81.2% |
| Paiute | 0.0 /100 | #323 | Tragic 81.2% |
| Cheyenne | 0.0 /100 | #324 | Tragic 81.1% |
| Dutch West Indians | 0.0 /100 | #325 | Tragic 81.0% |
Demographics Similar to Latvians by In Labor Force | Age 30-34
In terms of in labor force | age 30-34, the demographic groups most similar to Latvians are Immigrants from Cameroon (86.0%, a difference of 0.010%), Immigrants from Albania (86.1%, a difference of 0.030%), Immigrants from Cabo Verde (86.1%, a difference of 0.040%), Immigrants from Sierra Leone (86.0%, a difference of 0.040%), and Bolivian (86.1%, a difference of 0.060%).
| Demographics | Rating | Rank | In Labor Force | Age 30-34 |
| Immigrants | Somalia | 100.0 /100 | #9 | Exceptional 86.2% |
| Immigrants | Serbia | 100.0 /100 | #10 | Exceptional 86.2% |
| Carpatho Rusyns | 100.0 /100 | #11 | Exceptional 86.2% |
| Bolivians | 100.0 /100 | #12 | Exceptional 86.1% |
| Immigrants | Croatia | 100.0 /100 | #13 | Exceptional 86.1% |
| Immigrants | Cabo Verde | 100.0 /100 | #14 | Exceptional 86.1% |
| Immigrants | Albania | 100.0 /100 | #15 | Exceptional 86.1% |
| Latvians | 100.0 /100 | #16 | Exceptional 86.0% |
| Immigrants | Cameroon | 100.0 /100 | #17 | Exceptional 86.0% |
| Immigrants | Sierra Leone | 100.0 /100 | #18 | Exceptional 86.0% |
| Sierra Leoneans | 100.0 /100 | #19 | Exceptional 86.0% |
| Bulgarians | 100.0 /100 | #20 | Exceptional 86.0% |
| Immigrants | Bulgaria | 100.0 /100 | #21 | Exceptional 86.0% |
| Bermudans | 100.0 /100 | #22 | Exceptional 85.9% |
| Estonians | 100.0 /100 | #23 | Exceptional 85.9% |