Choctaw vs Assyrian/Chaldean/Syriac Male Poverty
COMPARE
Choctaw
Assyrian/Chaldean/Syriac
Male Poverty
Male Poverty Comparison
Choctaw
Assyrians/Chaldeans/Syriacs
14.4%
MALE POVERTY
0.0/ 100
METRIC RATING
312th/ 347
METRIC RANK
9.1%
MALE POVERTY
99.9/ 100
METRIC RATING
6th/ 347
METRIC RANK
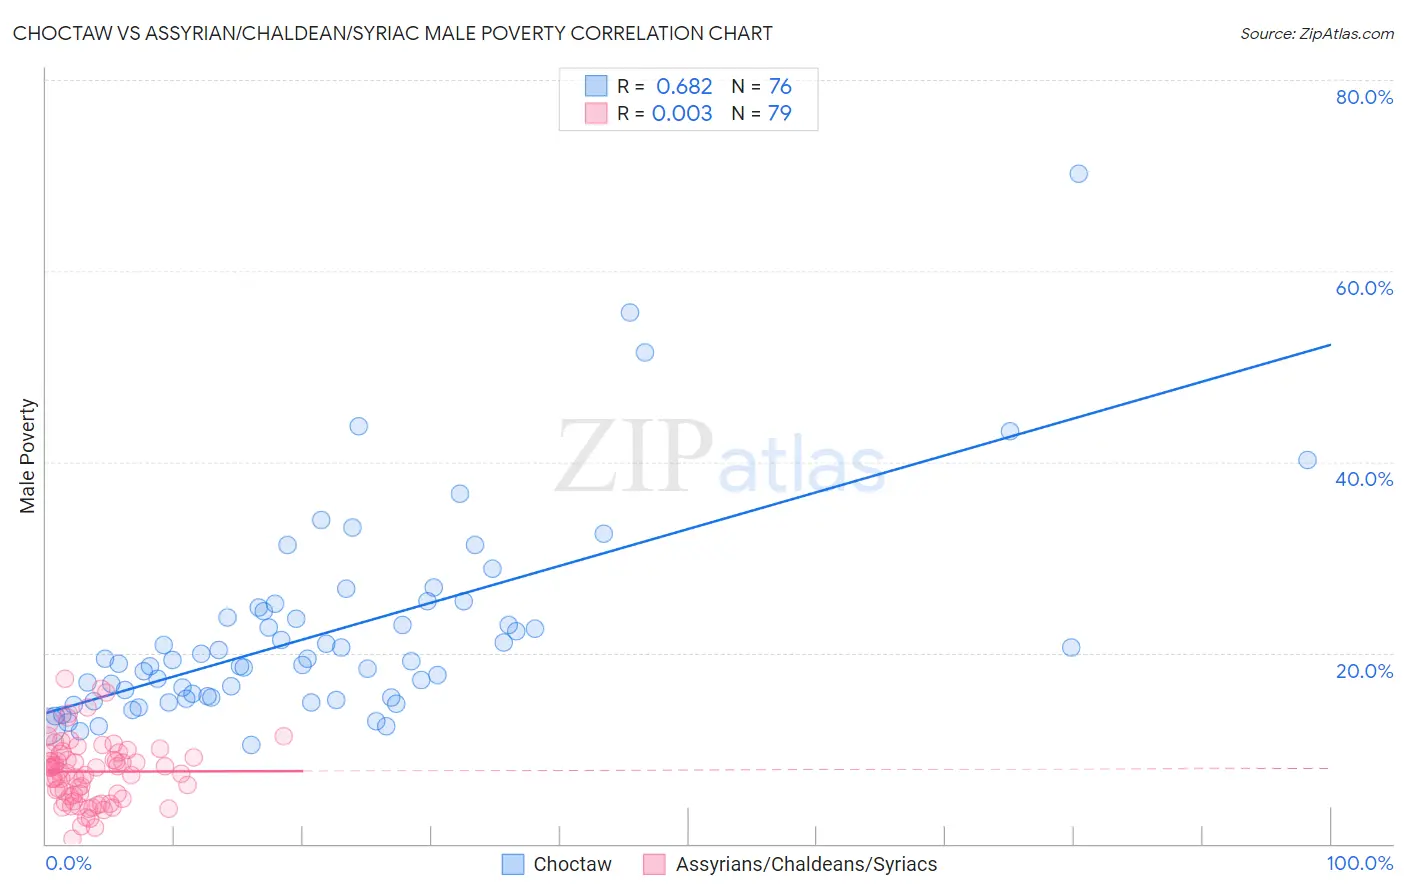
Choctaw vs Assyrian/Chaldean/Syriac Male Poverty Correlation Chart
The statistical analysis conducted on geographies consisting of 269,566,788 people shows a significant positive correlation between the proportion of Choctaw and poverty level among males in the United States with a correlation coefficient (R) of 0.682 and weighted average of 14.4%. Similarly, the statistical analysis conducted on geographies consisting of 110,288,408 people shows no correlation between the proportion of Assyrians/Chaldeans/Syriacs and poverty level among males in the United States with a correlation coefficient (R) of 0.003 and weighted average of 9.1%, a difference of 57.6%.
Male Poverty Correlation Summary
| Measurement | Choctaw | Assyrian/Chaldean/Syriac |
| Minimum | 10.4% | 0.52% |
| Maximum | 70.2% | 17.3% |
| Range | 59.8% | 16.8% |
| Mean | 22.2% | 7.6% |
| Median | 19.2% | 7.6% |
| Interquartile 25% (IQ1) | 15.3% | 4.9% |
| Interquartile 75% (IQ3) | 24.6% | 9.4% |
| Interquartile Range (IQR) | 9.3% | 4.5% |
| Standard Deviation (Sample) | 10.5% | 3.4% |
| Standard Deviation (Population) | 10.5% | 3.4% |
Similar Demographics by Male Poverty
Demographics Similar to Choctaw by Male Poverty
In terms of male poverty, the demographic groups most similar to Choctaw are Honduran (14.3%, a difference of 0.47%), Seminole (14.3%, a difference of 0.67%), Somali (14.3%, a difference of 0.88%), African (14.2%, a difference of 1.3%), and Dutch West Indian (14.2%, a difference of 1.3%).
| Demographics | Rating | Rank | Male Poverty |
| Immigrants | Bangladesh | 0.0 /100 | #305 | Tragic 14.1% |
| Creek | 0.0 /100 | #306 | Tragic 14.1% |
| Dutch West Indians | 0.0 /100 | #307 | Tragic 14.2% |
| Africans | 0.0 /100 | #308 | Tragic 14.2% |
| Somalis | 0.0 /100 | #309 | Tragic 14.3% |
| Seminole | 0.0 /100 | #310 | Tragic 14.3% |
| Hondurans | 0.0 /100 | #311 | Tragic 14.3% |
| Choctaw | 0.0 /100 | #312 | Tragic 14.4% |
| Immigrants | Somalia | 0.0 /100 | #313 | Tragic 14.6% |
| Immigrants | Honduras | 0.0 /100 | #314 | Tragic 14.6% |
| Chippewa | 0.0 /100 | #315 | Tragic 14.6% |
| British West Indians | 0.0 /100 | #316 | Tragic 14.6% |
| Immigrants | Dominica | 0.0 /100 | #317 | Tragic 14.7% |
| Immigrants | Grenada | 0.0 /100 | #318 | Tragic 14.7% |
| U.S. Virgin Islanders | 0.0 /100 | #319 | Tragic 14.7% |
Demographics Similar to Assyrians/Chaldeans/Syriacs by Male Poverty
In terms of male poverty, the demographic groups most similar to Assyrians/Chaldeans/Syriacs are Immigrants from Ireland (9.1%, a difference of 0.080%), Maltese (9.1%, a difference of 0.66%), Filipino (9.2%, a difference of 0.75%), Immigrants from South Central Asia (9.3%, a difference of 1.5%), and Bulgarian (9.3%, a difference of 2.1%).
| Demographics | Rating | Rank | Male Poverty |
| Immigrants | India | 100.0 /100 | #1 | Exceptional 8.2% |
| Chinese | 100.0 /100 | #2 | Exceptional 8.7% |
| Thais | 100.0 /100 | #3 | Exceptional 8.7% |
| Immigrants | Taiwan | 100.0 /100 | #4 | Exceptional 8.9% |
| Maltese | 100.0 /100 | #5 | Exceptional 9.1% |
| Assyrians/Chaldeans/Syriacs | 99.9 /100 | #6 | Exceptional 9.1% |
| Immigrants | Ireland | 99.9 /100 | #7 | Exceptional 9.1% |
| Filipinos | 99.9 /100 | #8 | Exceptional 9.2% |
| Immigrants | South Central Asia | 99.9 /100 | #9 | Exceptional 9.3% |
| Bulgarians | 99.9 /100 | #10 | Exceptional 9.3% |
| Bolivians | 99.9 /100 | #11 | Exceptional 9.4% |
| Immigrants | Bolivia | 99.9 /100 | #12 | Exceptional 9.4% |
| Immigrants | Lithuania | 99.9 /100 | #13 | Exceptional 9.4% |
| Immigrants | North Macedonia | 99.8 /100 | #14 | Exceptional 9.4% |
| Bhutanese | 99.8 /100 | #15 | Exceptional 9.5% |