Choctaw vs Bangladeshi Female Poverty Among 18-24 Year Olds
COMPARE
Choctaw
Bangladeshi
Female Poverty Among 18-24 Year Olds
Female Poverty Among 18-24 Year Olds Comparison
Choctaw
Bangladeshis
24.3%
FEMALE POVERTY AMONG 18-24 YEAR OLDS
0.0/ 100
METRIC RATING
314th/ 347
METRIC RANK
22.5%
FEMALE POVERTY AMONG 18-24 YEAR OLDS
0.0/ 100
METRIC RATING
291st/ 347
METRIC RANK
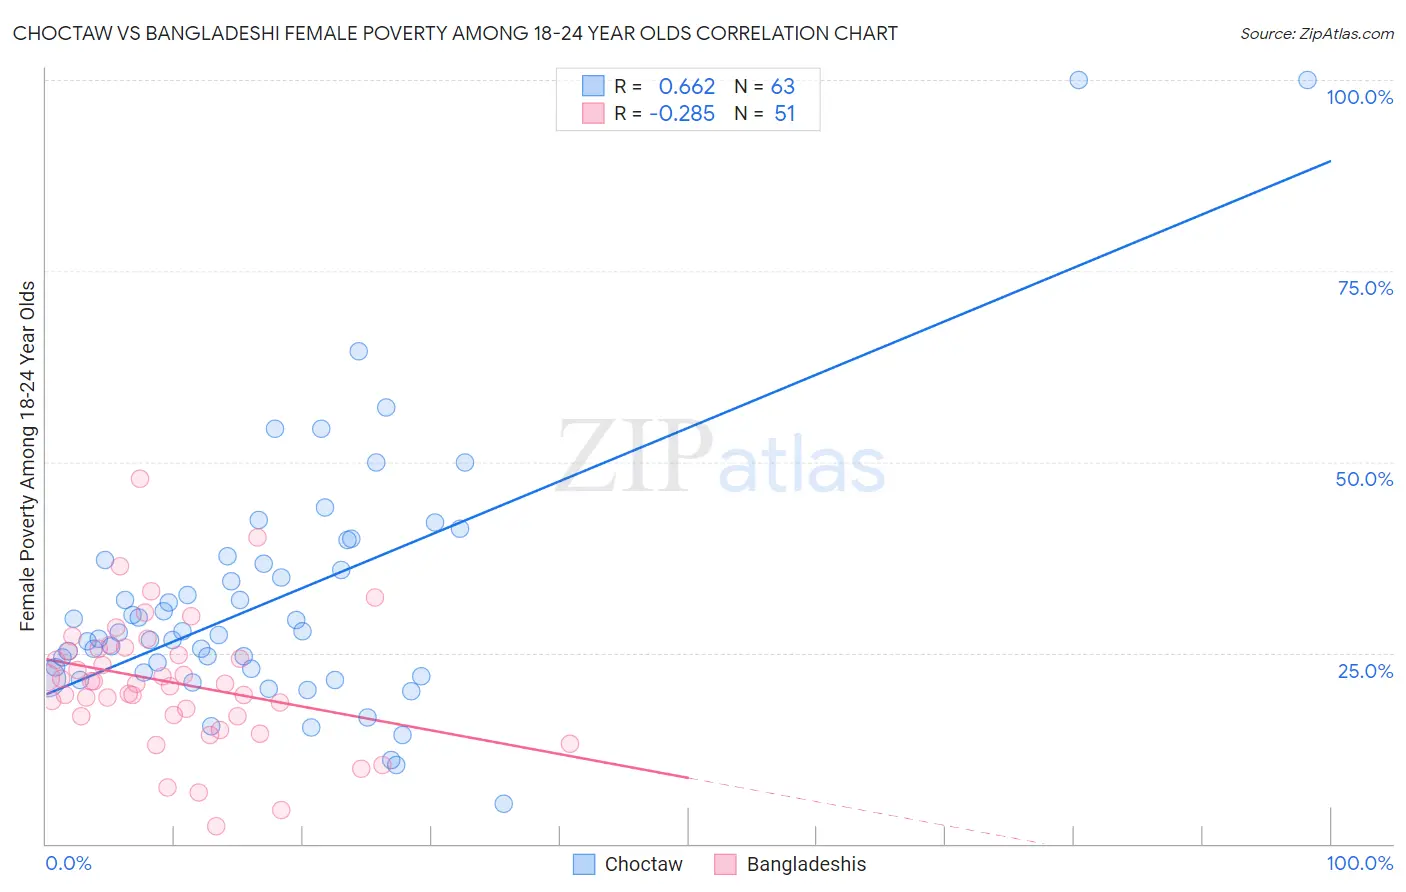
Choctaw vs Bangladeshi Female Poverty Among 18-24 Year Olds Correlation Chart
The statistical analysis conducted on geographies consisting of 265,726,107 people shows a significant positive correlation between the proportion of Choctaw and poverty level among females between the ages 18 and 24 in the United States with a correlation coefficient (R) of 0.662 and weighted average of 24.3%. Similarly, the statistical analysis conducted on geographies consisting of 140,222,354 people shows a weak negative correlation between the proportion of Bangladeshis and poverty level among females between the ages 18 and 24 in the United States with a correlation coefficient (R) of -0.285 and weighted average of 22.5%, a difference of 8.0%.
Female Poverty Among 18-24 Year Olds Correlation Summary
| Measurement | Choctaw | Bangladeshi |
| Minimum | 5.3% | 2.2% |
| Maximum | 100.0% | 47.8% |
| Range | 94.7% | 45.6% |
| Mean | 32.0% | 21.1% |
| Median | 27.7% | 20.9% |
| Interquartile 25% (IQ1) | 22.4% | 16.7% |
| Interquartile 75% (IQ3) | 37.2% | 25.5% |
| Interquartile Range (IQR) | 14.8% | 8.8% |
| Standard Deviation (Sample) | 17.0% | 8.5% |
| Standard Deviation (Population) | 16.8% | 8.4% |
Similar Demographics by Female Poverty Among 18-24 Year Olds
Demographics Similar to Choctaw by Female Poverty Among 18-24 Year Olds
In terms of female poverty among 18-24 year olds, the demographic groups most similar to Choctaw are Creek (24.2%, a difference of 0.16%), Black/African American (24.3%, a difference of 0.20%), Alsatian (24.4%, a difference of 0.51%), Osage (24.5%, a difference of 0.81%), and Chickasaw (24.5%, a difference of 0.89%).
| Demographics | Rating | Rank | Female Poverty Among 18-24 Year Olds |
| Cree | 0.0 /100 | #307 | Tragic 23.4% |
| Immigrants | Sudan | 0.0 /100 | #308 | Tragic 23.5% |
| Blackfeet | 0.0 /100 | #309 | Tragic 23.6% |
| Comanche | 0.0 /100 | #310 | Tragic 23.6% |
| Potawatomi | 0.0 /100 | #311 | Tragic 23.7% |
| Yuman | 0.0 /100 | #312 | Tragic 24.0% |
| Creek | 0.0 /100 | #313 | Tragic 24.2% |
| Choctaw | 0.0 /100 | #314 | Tragic 24.3% |
| Blacks/African Americans | 0.0 /100 | #315 | Tragic 24.3% |
| Alsatians | 0.0 /100 | #316 | Tragic 24.4% |
| Osage | 0.0 /100 | #317 | Tragic 24.5% |
| Chickasaw | 0.0 /100 | #318 | Tragic 24.5% |
| Dutch West Indians | 0.0 /100 | #319 | Tragic 24.5% |
| Immigrants | Congo | 0.0 /100 | #320 | Tragic 24.6% |
| Immigrants | Zaire | 0.0 /100 | #321 | Tragic 25.1% |
Demographics Similar to Bangladeshis by Female Poverty Among 18-24 Year Olds
In terms of female poverty among 18-24 year olds, the demographic groups most similar to Bangladeshis are Alaskan Athabascan (22.5%, a difference of 0.050%), U.S. Virgin Islander (22.5%, a difference of 0.080%), Indonesian (22.5%, a difference of 0.12%), Shoshone (22.5%, a difference of 0.24%), and Immigrants from Senegal (22.4%, a difference of 0.27%).
| Demographics | Rating | Rank | Female Poverty Among 18-24 Year Olds |
| Tlingit-Haida | 0.0 /100 | #284 | Tragic 22.0% |
| Ottawa | 0.0 /100 | #285 | Tragic 22.0% |
| Ugandans | 0.0 /100 | #286 | Tragic 22.1% |
| Immigrants | Middle Africa | 0.0 /100 | #287 | Tragic 22.1% |
| Dominicans | 0.0 /100 | #288 | Tragic 22.3% |
| French American Indians | 0.0 /100 | #289 | Tragic 22.3% |
| Immigrants | Senegal | 0.0 /100 | #290 | Tragic 22.4% |
| Bangladeshis | 0.0 /100 | #291 | Tragic 22.5% |
| Alaskan Athabascans | 0.0 /100 | #292 | Tragic 22.5% |
| U.S. Virgin Islanders | 0.0 /100 | #293 | Tragic 22.5% |
| Indonesians | 0.0 /100 | #294 | Tragic 22.5% |
| Shoshone | 0.0 /100 | #295 | Tragic 22.5% |
| Menominee | 0.0 /100 | #296 | Tragic 22.5% |
| Inupiat | 0.0 /100 | #297 | Tragic 22.6% |
| Central American Indians | 0.0 /100 | #298 | Tragic 22.6% |