Choctaw vs Cape Verdean Female Poverty Among 18-24 Year Olds
COMPARE
Choctaw
Cape Verdean
Female Poverty Among 18-24 Year Olds
Female Poverty Among 18-24 Year Olds Comparison
Choctaw
Cape Verdeans
24.3%
FEMALE POVERTY AMONG 18-24 YEAR OLDS
0.0/ 100
METRIC RATING
314th/ 347
METRIC RANK
19.4%
FEMALE POVERTY AMONG 18-24 YEAR OLDS
93.6/ 100
METRIC RATING
127th/ 347
METRIC RANK
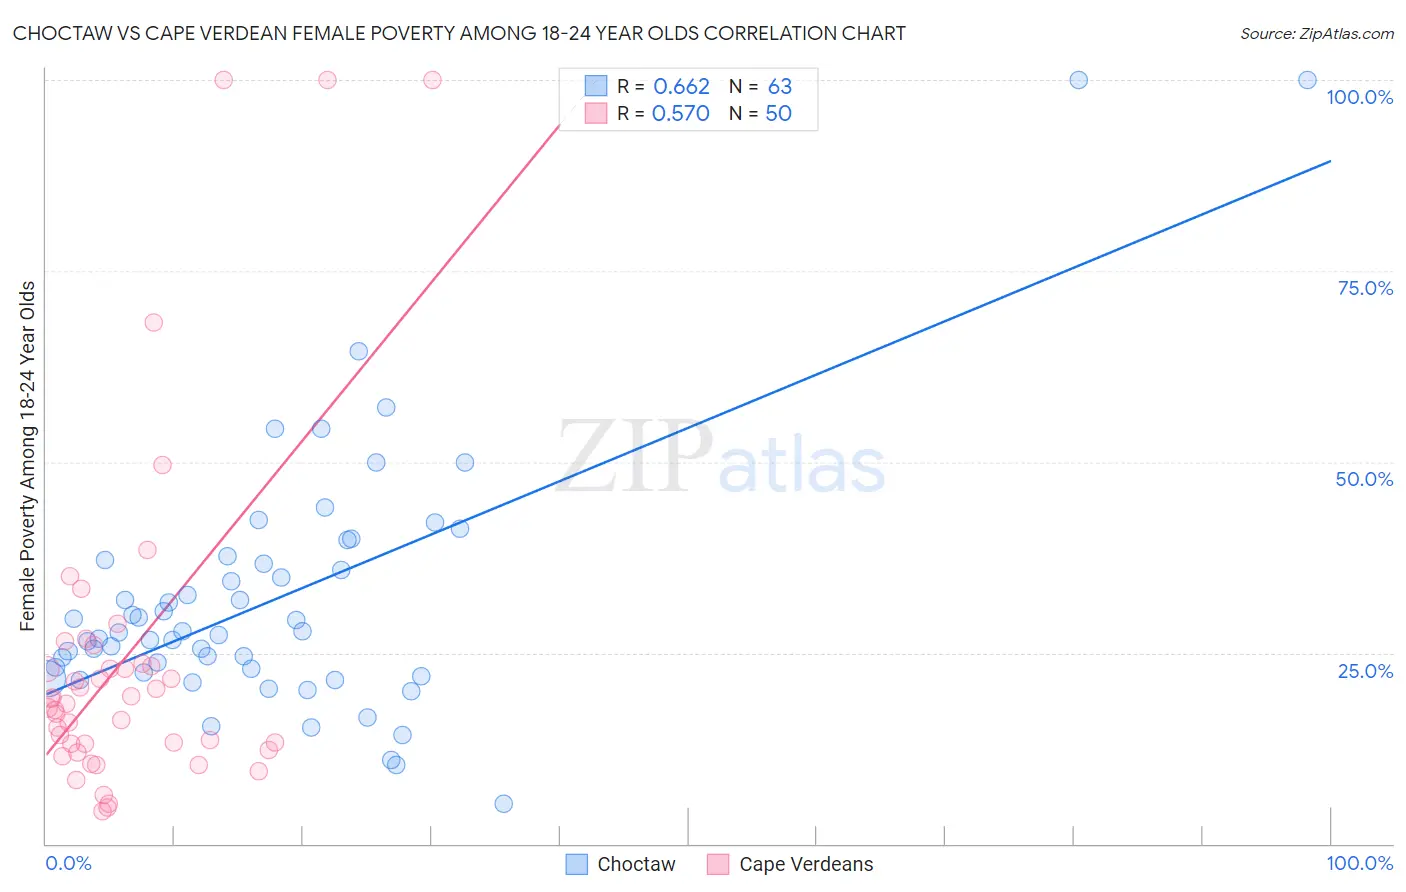
Choctaw vs Cape Verdean Female Poverty Among 18-24 Year Olds Correlation Chart
The statistical analysis conducted on geographies consisting of 265,726,107 people shows a significant positive correlation between the proportion of Choctaw and poverty level among females between the ages 18 and 24 in the United States with a correlation coefficient (R) of 0.662 and weighted average of 24.3%. Similarly, the statistical analysis conducted on geographies consisting of 106,282,002 people shows a substantial positive correlation between the proportion of Cape Verdeans and poverty level among females between the ages 18 and 24 in the United States with a correlation coefficient (R) of 0.570 and weighted average of 19.4%, a difference of 24.8%.
Female Poverty Among 18-24 Year Olds Correlation Summary
| Measurement | Choctaw | Cape Verdean |
| Minimum | 5.3% | 4.2% |
| Maximum | 100.0% | 100.0% |
| Range | 94.7% | 95.8% |
| Mean | 32.0% | 24.3% |
| Median | 27.7% | 18.6% |
| Interquartile 25% (IQ1) | 22.4% | 13.1% |
| Interquartile 75% (IQ3) | 37.2% | 23.6% |
| Interquartile Range (IQR) | 14.8% | 10.5% |
| Standard Deviation (Sample) | 17.0% | 22.3% |
| Standard Deviation (Population) | 16.8% | 22.1% |
Similar Demographics by Female Poverty Among 18-24 Year Olds
Demographics Similar to Choctaw by Female Poverty Among 18-24 Year Olds
In terms of female poverty among 18-24 year olds, the demographic groups most similar to Choctaw are Creek (24.2%, a difference of 0.16%), Black/African American (24.3%, a difference of 0.20%), Alsatian (24.4%, a difference of 0.51%), Osage (24.5%, a difference of 0.81%), and Chickasaw (24.5%, a difference of 0.89%).
| Demographics | Rating | Rank | Female Poverty Among 18-24 Year Olds |
| Cree | 0.0 /100 | #307 | Tragic 23.4% |
| Immigrants | Sudan | 0.0 /100 | #308 | Tragic 23.5% |
| Blackfeet | 0.0 /100 | #309 | Tragic 23.6% |
| Comanche | 0.0 /100 | #310 | Tragic 23.6% |
| Potawatomi | 0.0 /100 | #311 | Tragic 23.7% |
| Yuman | 0.0 /100 | #312 | Tragic 24.0% |
| Creek | 0.0 /100 | #313 | Tragic 24.2% |
| Choctaw | 0.0 /100 | #314 | Tragic 24.3% |
| Blacks/African Americans | 0.0 /100 | #315 | Tragic 24.3% |
| Alsatians | 0.0 /100 | #316 | Tragic 24.4% |
| Osage | 0.0 /100 | #317 | Tragic 24.5% |
| Chickasaw | 0.0 /100 | #318 | Tragic 24.5% |
| Dutch West Indians | 0.0 /100 | #319 | Tragic 24.5% |
| Immigrants | Congo | 0.0 /100 | #320 | Tragic 24.6% |
| Immigrants | Zaire | 0.0 /100 | #321 | Tragic 25.1% |
Demographics Similar to Cape Verdeans by Female Poverty Among 18-24 Year Olds
In terms of female poverty among 18-24 year olds, the demographic groups most similar to Cape Verdeans are Immigrants from Russia (19.4%, a difference of 0.020%), Immigrants from Panama (19.4%, a difference of 0.080%), Slovak (19.5%, a difference of 0.13%), Immigrants from England (19.5%, a difference of 0.14%), and Immigrants from Canada (19.5%, a difference of 0.14%).
| Demographics | Rating | Rank | Female Poverty Among 18-24 Year Olds |
| Immigrants | Northern Europe | 95.4 /100 | #120 | Exceptional 19.4% |
| Guyanese | 95.3 /100 | #121 | Exceptional 19.4% |
| Cambodians | 94.6 /100 | #122 | Exceptional 19.4% |
| Paraguayans | 94.6 /100 | #123 | Exceptional 19.4% |
| Immigrants | Chile | 94.3 /100 | #124 | Exceptional 19.4% |
| Immigrants | Panama | 94.0 /100 | #125 | Exceptional 19.4% |
| Immigrants | Russia | 93.7 /100 | #126 | Exceptional 19.4% |
| Cape Verdeans | 93.6 /100 | #127 | Exceptional 19.4% |
| Slovaks | 92.9 /100 | #128 | Exceptional 19.5% |
| Immigrants | England | 92.9 /100 | #129 | Exceptional 19.5% |
| Immigrants | Canada | 92.9 /100 | #130 | Exceptional 19.5% |
| Latvians | 92.7 /100 | #131 | Exceptional 19.5% |
| Jamaicans | 92.1 /100 | #132 | Exceptional 19.5% |
| Turks | 92.1 /100 | #133 | Exceptional 19.5% |
| Immigrants | North America | 92.1 /100 | #134 | Exceptional 19.5% |