Immigrants from Senegal vs Bangladeshi Female Poverty Among 18-24 Year Olds
COMPARE
Immigrants from Senegal
Bangladeshi
Female Poverty Among 18-24 Year Olds
Female Poverty Among 18-24 Year Olds Comparison
Immigrants from Senegal
Bangladeshis
22.4%
FEMALE POVERTY AMONG 18-24 YEAR OLDS
0.0/ 100
METRIC RATING
290th/ 347
METRIC RANK
22.5%
FEMALE POVERTY AMONG 18-24 YEAR OLDS
0.0/ 100
METRIC RATING
291st/ 347
METRIC RANK
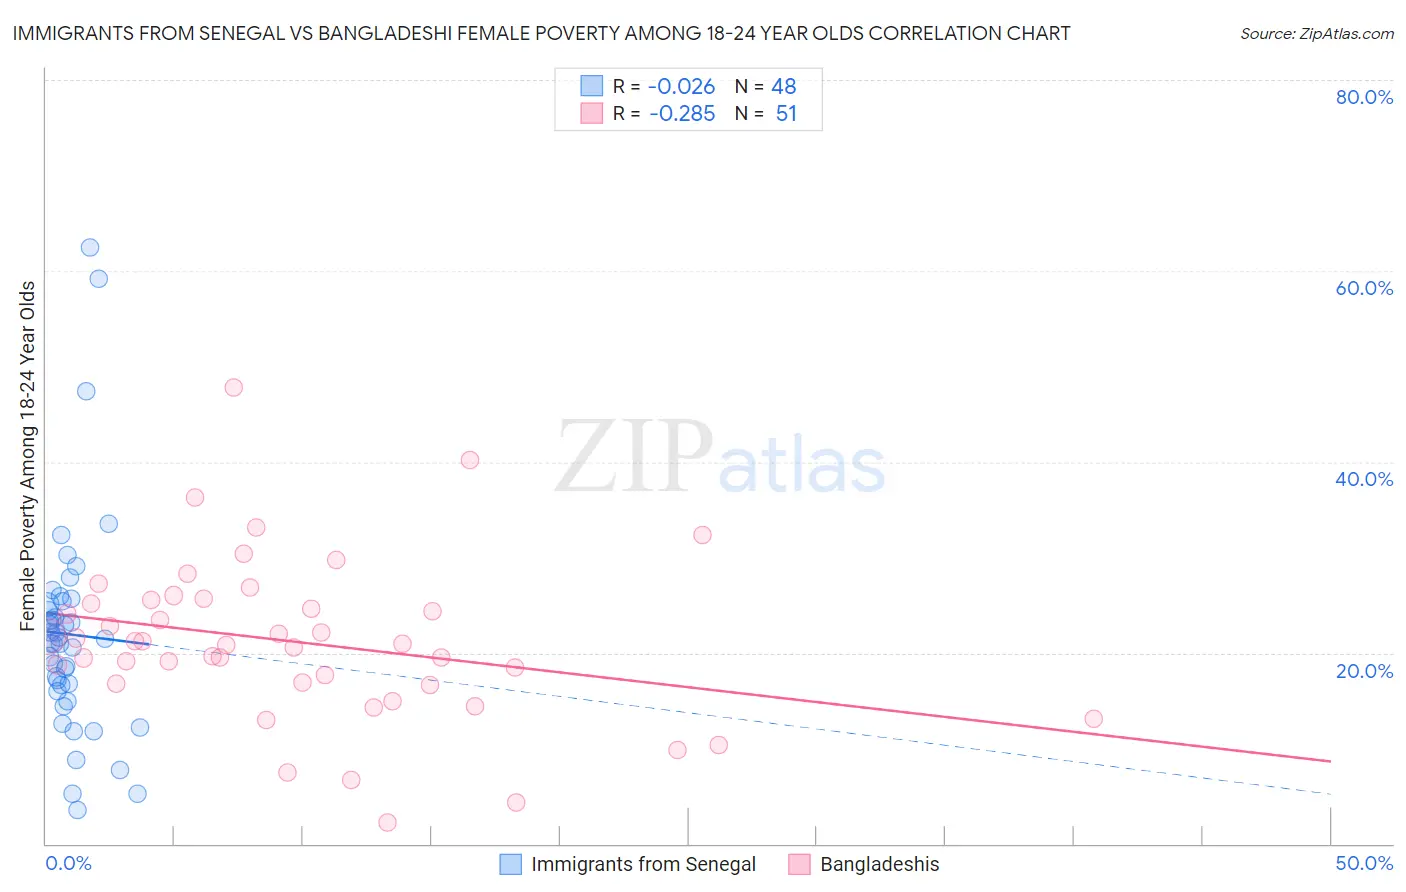
Immigrants from Senegal vs Bangladeshi Female Poverty Among 18-24 Year Olds Correlation Chart
The statistical analysis conducted on geographies consisting of 89,768,746 people shows no correlation between the proportion of Immigrants from Senegal and poverty level among females between the ages 18 and 24 in the United States with a correlation coefficient (R) of -0.026 and weighted average of 22.4%. Similarly, the statistical analysis conducted on geographies consisting of 140,222,354 people shows a weak negative correlation between the proportion of Bangladeshis and poverty level among females between the ages 18 and 24 in the United States with a correlation coefficient (R) of -0.285 and weighted average of 22.5%, a difference of 0.27%.
Female Poverty Among 18-24 Year Olds Correlation Summary
| Measurement | Immigrants from Senegal | Bangladeshi |
| Minimum | 3.6% | 2.2% |
| Maximum | 62.5% | 47.8% |
| Range | 58.9% | 45.6% |
| Mean | 21.9% | 21.1% |
| Median | 21.2% | 20.9% |
| Interquartile 25% (IQ1) | 16.3% | 16.7% |
| Interquartile 75% (IQ3) | 25.2% | 25.5% |
| Interquartile Range (IQR) | 8.9% | 8.8% |
| Standard Deviation (Sample) | 11.4% | 8.5% |
| Standard Deviation (Population) | 11.3% | 8.4% |
Demographics Similar to Immigrants from Senegal and Bangladeshis by Female Poverty Among 18-24 Year Olds
In terms of female poverty among 18-24 year olds, the demographic groups most similar to Immigrants from Senegal are Alaskan Athabascan (22.5%, a difference of 0.32%), U.S. Virgin Islander (22.5%, a difference of 0.36%), Indonesian (22.5%, a difference of 0.39%), Shoshone (22.5%, a difference of 0.51%), and French American Indian (22.3%, a difference of 0.58%). Similarly, the demographic groups most similar to Bangladeshis are Alaskan Athabascan (22.5%, a difference of 0.050%), U.S. Virgin Islander (22.5%, a difference of 0.080%), Indonesian (22.5%, a difference of 0.12%), Shoshone (22.5%, a difference of 0.24%), and Menominee (22.5%, a difference of 0.35%).
| Demographics | Rating | Rank | Female Poverty Among 18-24 Year Olds |
| Immigrants | Dominica | 0.1 /100 | #280 | Tragic 21.9% |
| Immigrants | Dominican Republic | 0.1 /100 | #281 | Tragic 21.9% |
| Bermudans | 0.1 /100 | #282 | Tragic 21.9% |
| Sub-Saharan Africans | 0.0 /100 | #283 | Tragic 22.0% |
| Tlingit-Haida | 0.0 /100 | #284 | Tragic 22.0% |
| Ottawa | 0.0 /100 | #285 | Tragic 22.0% |
| Ugandans | 0.0 /100 | #286 | Tragic 22.1% |
| Immigrants | Middle Africa | 0.0 /100 | #287 | Tragic 22.1% |
| Dominicans | 0.0 /100 | #288 | Tragic 22.3% |
| French American Indians | 0.0 /100 | #289 | Tragic 22.3% |
| Immigrants | Senegal | 0.0 /100 | #290 | Tragic 22.4% |
| Bangladeshis | 0.0 /100 | #291 | Tragic 22.5% |
| Alaskan Athabascans | 0.0 /100 | #292 | Tragic 22.5% |
| U.S. Virgin Islanders | 0.0 /100 | #293 | Tragic 22.5% |
| Indonesians | 0.0 /100 | #294 | Tragic 22.5% |
| Shoshone | 0.0 /100 | #295 | Tragic 22.5% |
| Menominee | 0.0 /100 | #296 | Tragic 22.5% |
| Inupiat | 0.0 /100 | #297 | Tragic 22.6% |
| Central American Indians | 0.0 /100 | #298 | Tragic 22.6% |
| Cherokee | 0.0 /100 | #299 | Tragic 22.7% |
| Africans | 0.0 /100 | #300 | Tragic 22.8% |