Immigrants from England vs Bangladeshi Female Poverty Among 18-24 Year Olds
COMPARE
Immigrants from England
Bangladeshi
Female Poverty Among 18-24 Year Olds
Female Poverty Among 18-24 Year Olds Comparison
Immigrants from England
Bangladeshis
19.5%
FEMALE POVERTY AMONG 18-24 YEAR OLDS
92.9/ 100
METRIC RATING
129th/ 347
METRIC RANK
22.5%
FEMALE POVERTY AMONG 18-24 YEAR OLDS
0.0/ 100
METRIC RATING
291st/ 347
METRIC RANK
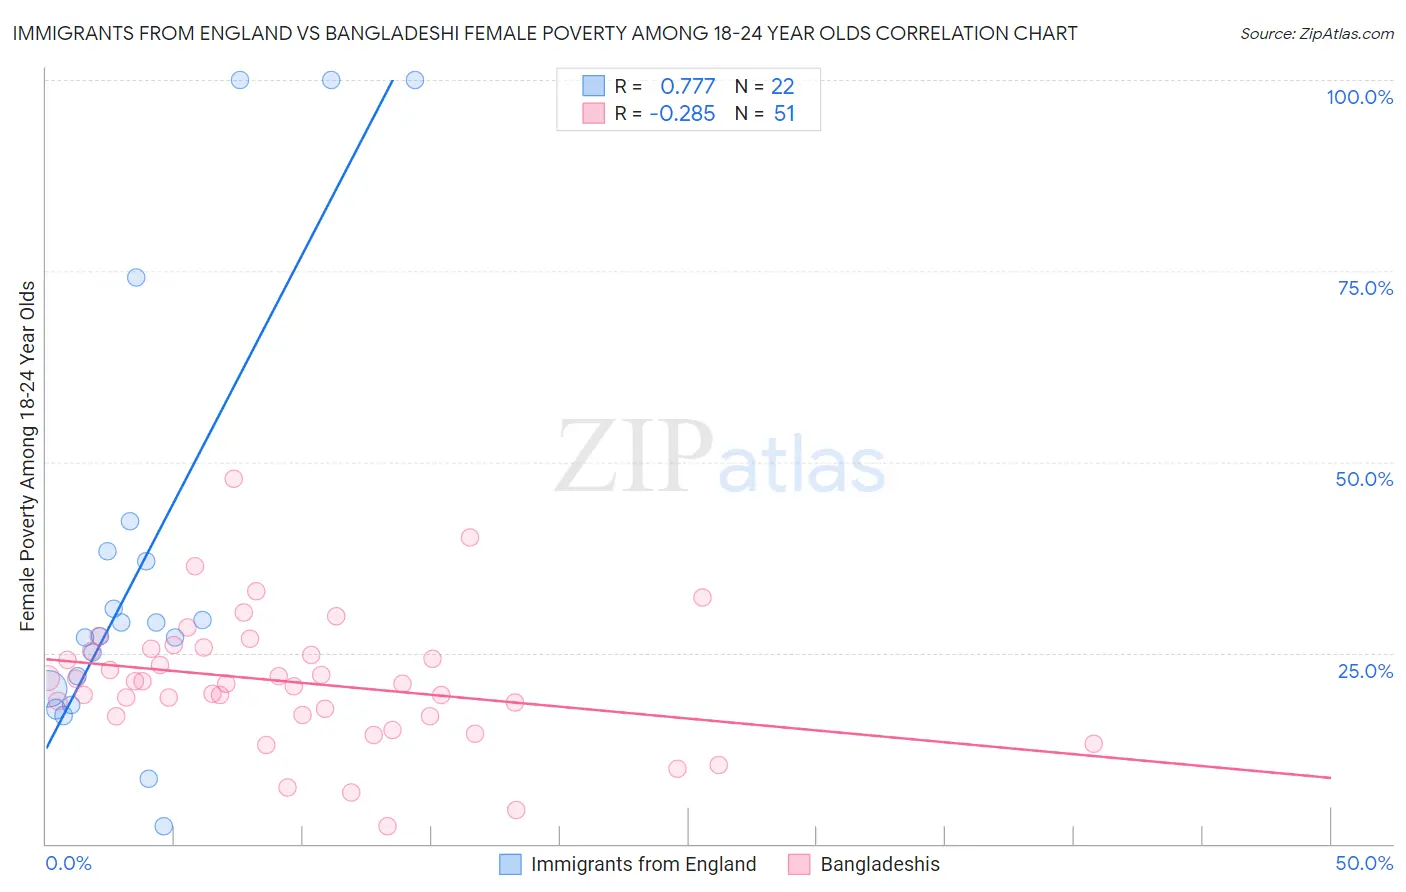
Immigrants from England vs Bangladeshi Female Poverty Among 18-24 Year Olds Correlation Chart
The statistical analysis conducted on geographies consisting of 380,023,183 people shows a strong positive correlation between the proportion of Immigrants from England and poverty level among females between the ages 18 and 24 in the United States with a correlation coefficient (R) of 0.777 and weighted average of 19.5%. Similarly, the statistical analysis conducted on geographies consisting of 140,222,354 people shows a weak negative correlation between the proportion of Bangladeshis and poverty level among females between the ages 18 and 24 in the United States with a correlation coefficient (R) of -0.285 and weighted average of 22.5%, a difference of 15.4%.
Female Poverty Among 18-24 Year Olds Correlation Summary
| Measurement | Immigrants from England | Bangladeshi |
| Minimum | 2.2% | 2.2% |
| Maximum | 100.0% | 47.8% |
| Range | 97.8% | 45.6% |
| Mean | 37.3% | 21.1% |
| Median | 28.1% | 20.9% |
| Interquartile 25% (IQ1) | 20.3% | 16.7% |
| Interquartile 75% (IQ3) | 38.2% | 25.5% |
| Interquartile Range (IQR) | 18.0% | 8.8% |
| Standard Deviation (Sample) | 29.0% | 8.5% |
| Standard Deviation (Population) | 28.3% | 8.4% |
Similar Demographics by Female Poverty Among 18-24 Year Olds
Demographics Similar to Immigrants from England by Female Poverty Among 18-24 Year Olds
In terms of female poverty among 18-24 year olds, the demographic groups most similar to Immigrants from England are Slovak (19.5%, a difference of 0.0%), Immigrants from Canada (19.5%, a difference of 0.0%), Latvian (19.5%, a difference of 0.040%), Cape Verdean (19.4%, a difference of 0.14%), and Jamaican (19.5%, a difference of 0.15%).
| Demographics | Rating | Rank | Female Poverty Among 18-24 Year Olds |
| Cambodians | 94.6 /100 | #122 | Exceptional 19.4% |
| Paraguayans | 94.6 /100 | #123 | Exceptional 19.4% |
| Immigrants | Chile | 94.3 /100 | #124 | Exceptional 19.4% |
| Immigrants | Panama | 94.0 /100 | #125 | Exceptional 19.4% |
| Immigrants | Russia | 93.7 /100 | #126 | Exceptional 19.4% |
| Cape Verdeans | 93.6 /100 | #127 | Exceptional 19.4% |
| Slovaks | 92.9 /100 | #128 | Exceptional 19.5% |
| Immigrants | England | 92.9 /100 | #129 | Exceptional 19.5% |
| Immigrants | Canada | 92.9 /100 | #130 | Exceptional 19.5% |
| Latvians | 92.7 /100 | #131 | Exceptional 19.5% |
| Jamaicans | 92.1 /100 | #132 | Exceptional 19.5% |
| Turks | 92.1 /100 | #133 | Exceptional 19.5% |
| Immigrants | North America | 92.1 /100 | #134 | Exceptional 19.5% |
| Soviet Union | 92.0 /100 | #135 | Exceptional 19.5% |
| Russians | 91.5 /100 | #136 | Exceptional 19.5% |
Demographics Similar to Bangladeshis by Female Poverty Among 18-24 Year Olds
In terms of female poverty among 18-24 year olds, the demographic groups most similar to Bangladeshis are Alaskan Athabascan (22.5%, a difference of 0.050%), U.S. Virgin Islander (22.5%, a difference of 0.080%), Indonesian (22.5%, a difference of 0.12%), Shoshone (22.5%, a difference of 0.24%), and Immigrants from Senegal (22.4%, a difference of 0.27%).
| Demographics | Rating | Rank | Female Poverty Among 18-24 Year Olds |
| Tlingit-Haida | 0.0 /100 | #284 | Tragic 22.0% |
| Ottawa | 0.0 /100 | #285 | Tragic 22.0% |
| Ugandans | 0.0 /100 | #286 | Tragic 22.1% |
| Immigrants | Middle Africa | 0.0 /100 | #287 | Tragic 22.1% |
| Dominicans | 0.0 /100 | #288 | Tragic 22.3% |
| French American Indians | 0.0 /100 | #289 | Tragic 22.3% |
| Immigrants | Senegal | 0.0 /100 | #290 | Tragic 22.4% |
| Bangladeshis | 0.0 /100 | #291 | Tragic 22.5% |
| Alaskan Athabascans | 0.0 /100 | #292 | Tragic 22.5% |
| U.S. Virgin Islanders | 0.0 /100 | #293 | Tragic 22.5% |
| Indonesians | 0.0 /100 | #294 | Tragic 22.5% |
| Shoshone | 0.0 /100 | #295 | Tragic 22.5% |
| Menominee | 0.0 /100 | #296 | Tragic 22.5% |
| Inupiat | 0.0 /100 | #297 | Tragic 22.6% |
| Central American Indians | 0.0 /100 | #298 | Tragic 22.6% |