Immigrants from Uganda vs Bangladeshi Female Poverty Among 18-24 Year Olds
COMPARE
Immigrants from Uganda
Bangladeshi
Female Poverty Among 18-24 Year Olds
Female Poverty Among 18-24 Year Olds Comparison
Immigrants from Uganda
Bangladeshis
20.8%
FEMALE POVERTY AMONG 18-24 YEAR OLDS
5.1/ 100
METRIC RATING
235th/ 347
METRIC RANK
22.5%
FEMALE POVERTY AMONG 18-24 YEAR OLDS
0.0/ 100
METRIC RATING
291st/ 347
METRIC RANK
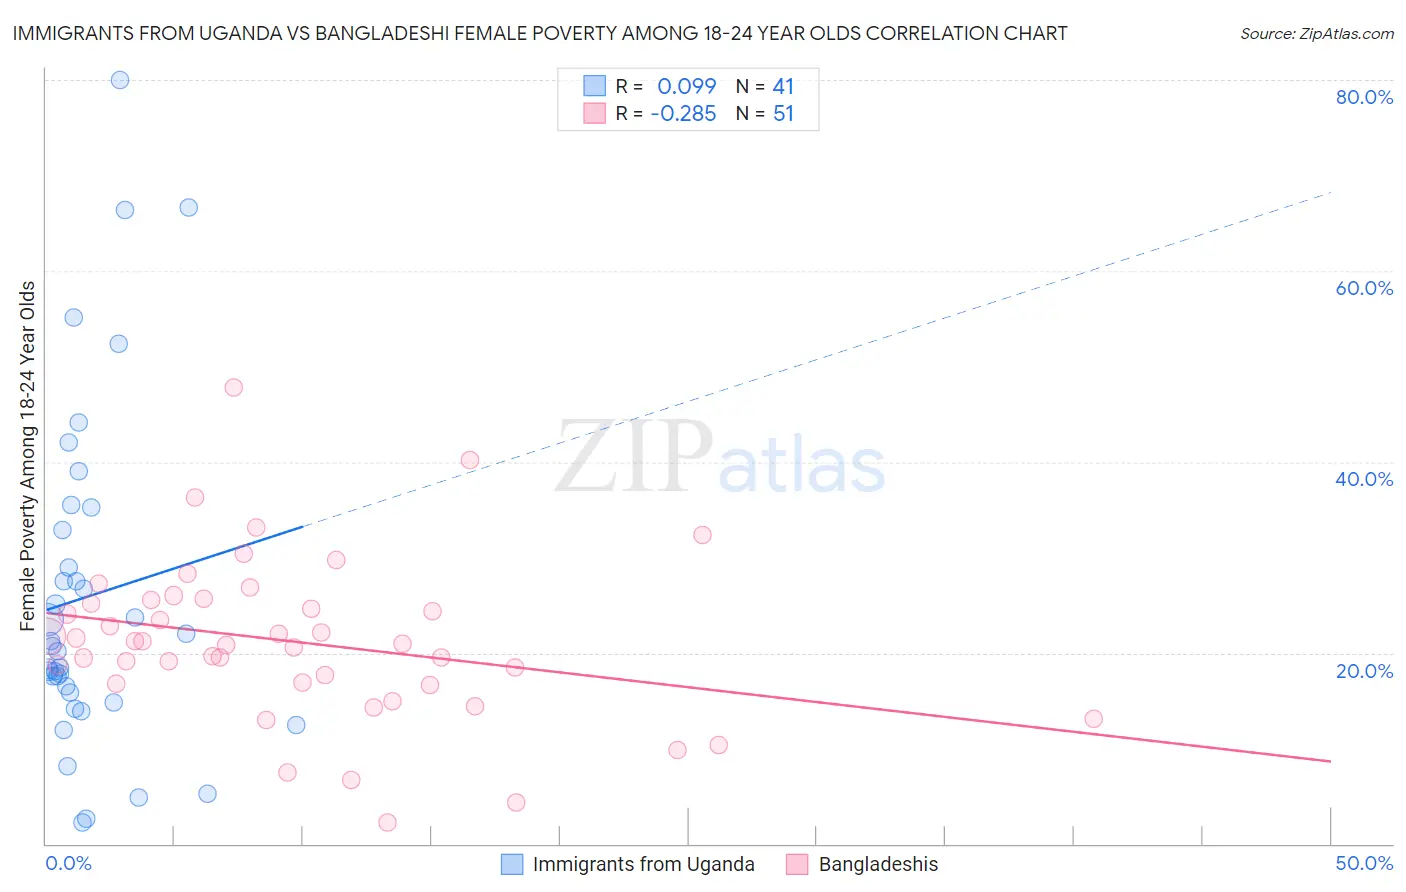
Immigrants from Uganda vs Bangladeshi Female Poverty Among 18-24 Year Olds Correlation Chart
The statistical analysis conducted on geographies consisting of 125,287,235 people shows a slight positive correlation between the proportion of Immigrants from Uganda and poverty level among females between the ages 18 and 24 in the United States with a correlation coefficient (R) of 0.099 and weighted average of 20.8%. Similarly, the statistical analysis conducted on geographies consisting of 140,222,354 people shows a weak negative correlation between the proportion of Bangladeshis and poverty level among females between the ages 18 and 24 in the United States with a correlation coefficient (R) of -0.285 and weighted average of 22.5%, a difference of 7.9%.
Female Poverty Among 18-24 Year Olds Correlation Summary
| Measurement | Immigrants from Uganda | Bangladeshi |
| Minimum | 2.2% | 2.2% |
| Maximum | 80.0% | 47.8% |
| Range | 77.8% | 45.6% |
| Mean | 26.0% | 21.1% |
| Median | 20.7% | 20.9% |
| Interquartile 25% (IQ1) | 15.3% | 16.7% |
| Interquartile 75% (IQ3) | 34.0% | 25.5% |
| Interquartile Range (IQR) | 18.7% | 8.8% |
| Standard Deviation (Sample) | 17.7% | 8.5% |
| Standard Deviation (Population) | 17.5% | 8.4% |
Similar Demographics by Female Poverty Among 18-24 Year Olds
Demographics Similar to Immigrants from Uganda by Female Poverty Among 18-24 Year Olds
In terms of female poverty among 18-24 year olds, the demographic groups most similar to Immigrants from Uganda are Okinawan (20.8%, a difference of 0.040%), Welsh (20.8%, a difference of 0.080%), Scottish (20.9%, a difference of 0.15%), Immigrants from Denmark (20.8%, a difference of 0.18%), and Immigrants from Singapore (20.9%, a difference of 0.18%).
| Demographics | Rating | Rank | Female Poverty Among 18-24 Year Olds |
| Ghanaians | 6.5 /100 | #228 | Tragic 20.8% |
| Australians | 6.1 /100 | #229 | Tragic 20.8% |
| Whites/Caucasians | 6.1 /100 | #230 | Tragic 20.8% |
| Immigrants | St. Vincent and the Grenadines | 6.0 /100 | #231 | Tragic 20.8% |
| Finns | 6.0 /100 | #232 | Tragic 20.8% |
| Immigrants | Denmark | 5.8 /100 | #233 | Tragic 20.8% |
| Welsh | 5.4 /100 | #234 | Tragic 20.8% |
| Immigrants | Uganda | 5.1 /100 | #235 | Tragic 20.8% |
| Okinawans | 4.9 /100 | #236 | Tragic 20.8% |
| Scottish | 4.5 /100 | #237 | Tragic 20.9% |
| Immigrants | Singapore | 4.4 /100 | #238 | Tragic 20.9% |
| Immigrants | Guatemala | 4.3 /100 | #239 | Tragic 20.9% |
| Luxembourgers | 4.2 /100 | #240 | Tragic 20.9% |
| Immigrants | Eritrea | 4.2 /100 | #241 | Tragic 20.9% |
| Israelis | 4.1 /100 | #242 | Tragic 20.9% |
Demographics Similar to Bangladeshis by Female Poverty Among 18-24 Year Olds
In terms of female poverty among 18-24 year olds, the demographic groups most similar to Bangladeshis are Alaskan Athabascan (22.5%, a difference of 0.050%), U.S. Virgin Islander (22.5%, a difference of 0.080%), Indonesian (22.5%, a difference of 0.12%), Shoshone (22.5%, a difference of 0.24%), and Immigrants from Senegal (22.4%, a difference of 0.27%).
| Demographics | Rating | Rank | Female Poverty Among 18-24 Year Olds |
| Tlingit-Haida | 0.0 /100 | #284 | Tragic 22.0% |
| Ottawa | 0.0 /100 | #285 | Tragic 22.0% |
| Ugandans | 0.0 /100 | #286 | Tragic 22.1% |
| Immigrants | Middle Africa | 0.0 /100 | #287 | Tragic 22.1% |
| Dominicans | 0.0 /100 | #288 | Tragic 22.3% |
| French American Indians | 0.0 /100 | #289 | Tragic 22.3% |
| Immigrants | Senegal | 0.0 /100 | #290 | Tragic 22.4% |
| Bangladeshis | 0.0 /100 | #291 | Tragic 22.5% |
| Alaskan Athabascans | 0.0 /100 | #292 | Tragic 22.5% |
| U.S. Virgin Islanders | 0.0 /100 | #293 | Tragic 22.5% |
| Indonesians | 0.0 /100 | #294 | Tragic 22.5% |
| Shoshone | 0.0 /100 | #295 | Tragic 22.5% |
| Menominee | 0.0 /100 | #296 | Tragic 22.5% |
| Inupiat | 0.0 /100 | #297 | Tragic 22.6% |
| Central American Indians | 0.0 /100 | #298 | Tragic 22.6% |