Chippewa vs U.S. Virgin Islander Professional Degree
COMPARE
Chippewa
U.S. Virgin Islander
Professional Degree
Professional Degree Comparison
Chippewa
U.S. Virgin Islanders
3.5%
PROFESSIONAL DEGREE
0.3/ 100
METRIC RATING
290th/ 347
METRIC RANK
3.7%
PROFESSIONAL DEGREE
1.0/ 100
METRIC RATING
262nd/ 347
METRIC RANK
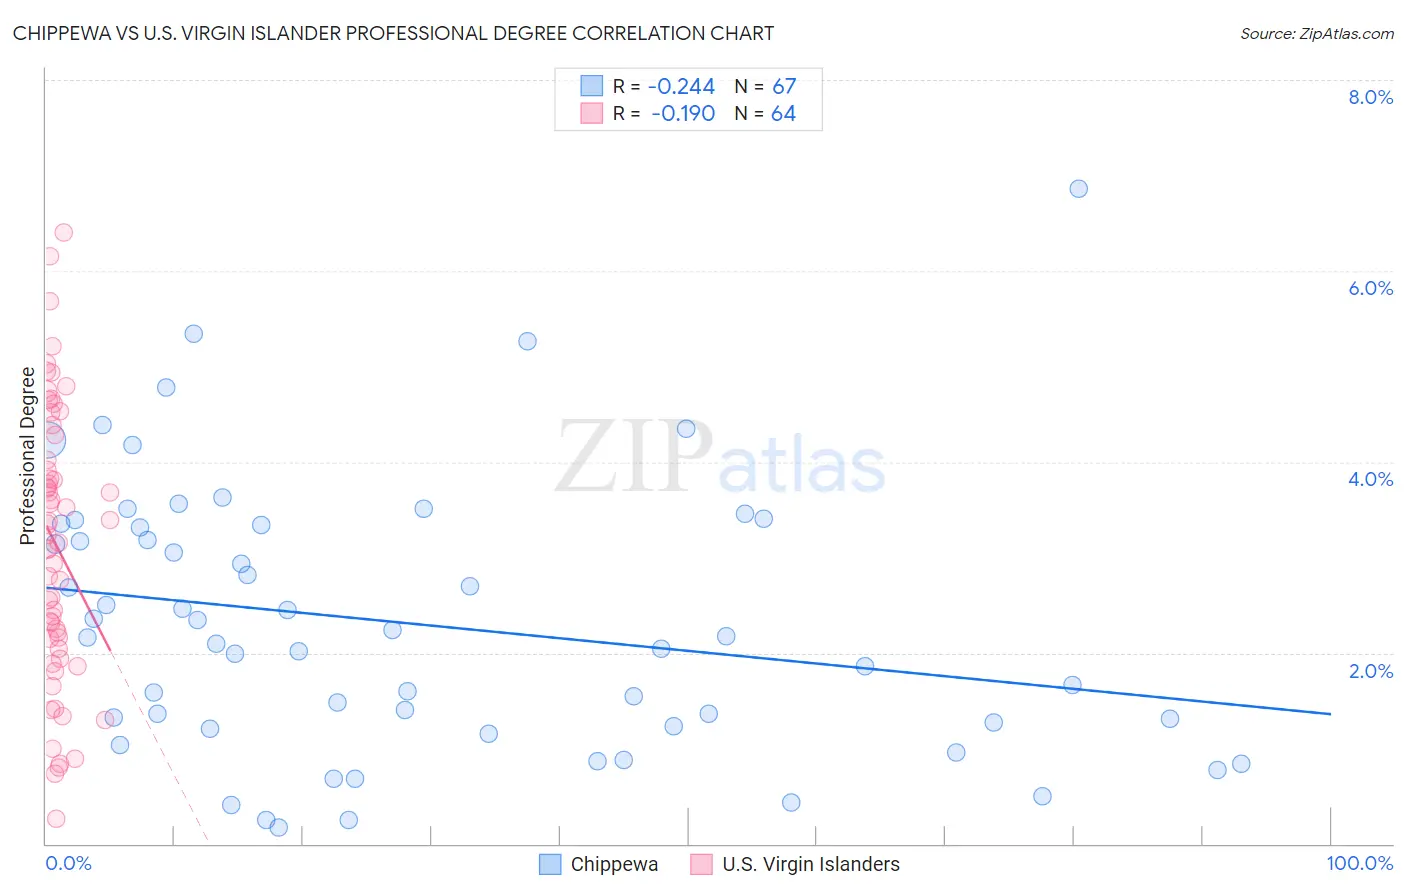
Chippewa vs U.S. Virgin Islander Professional Degree Correlation Chart
The statistical analysis conducted on geographies consisting of 214,425,130 people shows a weak negative correlation between the proportion of Chippewa and percentage of population with at least professional degree education in the United States with a correlation coefficient (R) of -0.244 and weighted average of 3.5%. Similarly, the statistical analysis conducted on geographies consisting of 87,432,219 people shows a poor negative correlation between the proportion of U.S. Virgin Islanders and percentage of population with at least professional degree education in the United States with a correlation coefficient (R) of -0.190 and weighted average of 3.7%, a difference of 5.7%.
Professional Degree Correlation Summary
| Measurement | Chippewa | U.S. Virgin Islander |
| Minimum | 0.17% | 0.26% |
| Maximum | 6.9% | 6.4% |
| Range | 6.7% | 6.1% |
| Mean | 2.3% | 3.1% |
| Median | 2.2% | 3.2% |
| Interquartile 25% (IQ1) | 1.2% | 2.1% |
| Interquartile 75% (IQ3) | 3.3% | 4.1% |
| Interquartile Range (IQR) | 2.1% | 2.1% |
| Standard Deviation (Sample) | 1.4% | 1.4% |
| Standard Deviation (Population) | 1.4% | 1.4% |
Similar Demographics by Professional Degree
Demographics Similar to Chippewa by Professional Degree
In terms of professional degree, the demographic groups most similar to Chippewa are Guatemalan (3.5%, a difference of 0.010%), Alaska Native (3.5%, a difference of 0.17%), Blackfeet (3.5%, a difference of 0.19%), Immigrants from El Salvador (3.5%, a difference of 0.23%), and Immigrants from Belize (3.5%, a difference of 0.24%).
| Demographics | Rating | Rank | Professional Degree |
| Comanche | 0.4 /100 | #283 | Tragic 3.5% |
| Salvadorans | 0.4 /100 | #284 | Tragic 3.5% |
| Hondurans | 0.3 /100 | #285 | Tragic 3.5% |
| Haitians | 0.3 /100 | #286 | Tragic 3.5% |
| Immigrants | El Salvador | 0.3 /100 | #287 | Tragic 3.5% |
| Blackfeet | 0.3 /100 | #288 | Tragic 3.5% |
| Guatemalans | 0.3 /100 | #289 | Tragic 3.5% |
| Chippewa | 0.3 /100 | #290 | Tragic 3.5% |
| Alaska Natives | 0.3 /100 | #291 | Tragic 3.5% |
| Immigrants | Belize | 0.3 /100 | #292 | Tragic 3.5% |
| Immigrants | Honduras | 0.3 /100 | #293 | Tragic 3.5% |
| Paiute | 0.3 /100 | #294 | Tragic 3.4% |
| Immigrants | Guatemala | 0.2 /100 | #295 | Tragic 3.4% |
| Hawaiians | 0.2 /100 | #296 | Tragic 3.4% |
| Immigrants | Liberia | 0.2 /100 | #297 | Tragic 3.4% |
Demographics Similar to U.S. Virgin Islanders by Professional Degree
In terms of professional degree, the demographic groups most similar to U.S. Virgin Islanders are Immigrants from Guyana (3.7%, a difference of 0.010%), Indonesian (3.7%, a difference of 0.19%), African (3.7%, a difference of 0.20%), Immigrants from St. Vincent and the Grenadines (3.7%, a difference of 0.42%), and Bahamian (3.7%, a difference of 0.50%).
| Demographics | Rating | Rank | Professional Degree |
| Osage | 1.2 /100 | #255 | Tragic 3.7% |
| Iroquois | 1.2 /100 | #256 | Tragic 3.7% |
| Bahamians | 1.1 /100 | #257 | Tragic 3.7% |
| Immigrants | St. Vincent and the Grenadines | 1.1 /100 | #258 | Tragic 3.7% |
| Africans | 1.0 /100 | #259 | Tragic 3.7% |
| Indonesians | 1.0 /100 | #260 | Tragic 3.7% |
| Immigrants | Guyana | 1.0 /100 | #261 | Tragic 3.7% |
| U.S. Virgin Islanders | 1.0 /100 | #262 | Tragic 3.7% |
| Hopi | 0.9 /100 | #263 | Tragic 3.6% |
| Immigrants | Cambodia | 0.9 /100 | #264 | Tragic 3.6% |
| Immigrants | Congo | 0.8 /100 | #265 | Tragic 3.6% |
| Central American Indians | 0.8 /100 | #266 | Tragic 3.6% |
| Delaware | 0.7 /100 | #267 | Tragic 3.6% |
| Aleuts | 0.7 /100 | #268 | Tragic 3.6% |
| Immigrants | Cuba | 0.6 /100 | #269 | Tragic 3.6% |