Chippewa vs Puget Sound Salish Female Poverty
COMPARE
Chippewa
Puget Sound Salish
Female Poverty
Female Poverty Comparison
Chippewa
Puget Sound Salish
16.7%
FEMALE POVERTY
0.0/ 100
METRIC RATING
302nd/ 347
METRIC RANK
12.7%
FEMALE POVERTY
91.5/ 100
METRIC RATING
115th/ 347
METRIC RANK
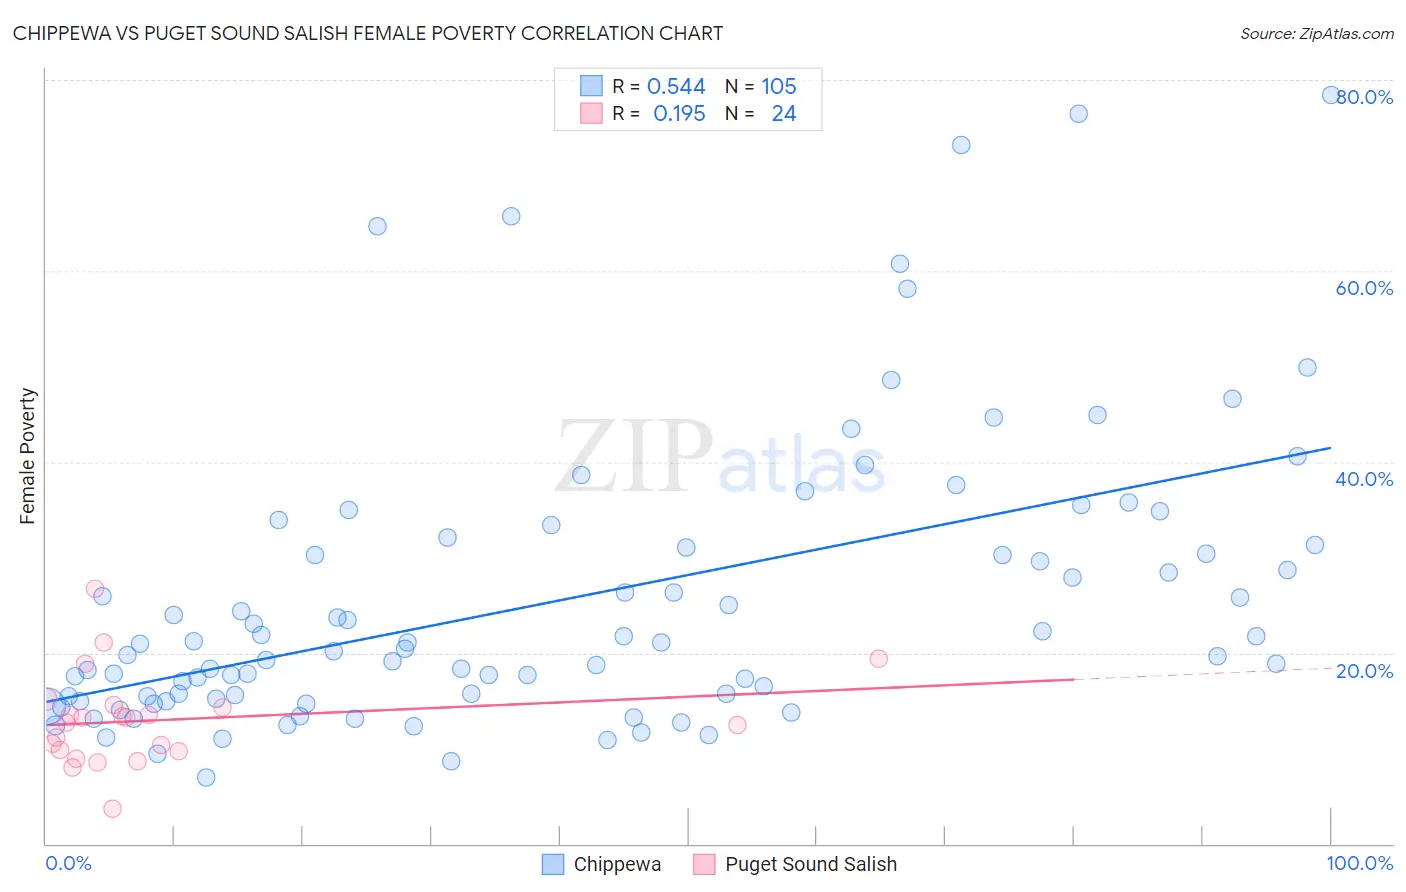
Chippewa vs Puget Sound Salish Female Poverty Correlation Chart
The statistical analysis conducted on geographies consisting of 214,995,312 people shows a substantial positive correlation between the proportion of Chippewa and poverty level among females in the United States with a correlation coefficient (R) of 0.544 and weighted average of 16.7%. Similarly, the statistical analysis conducted on geographies consisting of 46,146,424 people shows a poor positive correlation between the proportion of Puget Sound Salish and poverty level among females in the United States with a correlation coefficient (R) of 0.195 and weighted average of 12.7%, a difference of 31.9%.
Female Poverty Correlation Summary
| Measurement | Chippewa | Puget Sound Salish |
| Minimum | 7.0% | 3.6% |
| Maximum | 78.4% | 26.7% |
| Range | 71.4% | 23.1% |
| Mean | 25.6% | 13.0% |
| Median | 20.4% | 13.0% |
| Interquartile 25% (IQ1) | 15.3% | 9.8% |
| Interquartile 75% (IQ3) | 31.2% | 14.4% |
| Interquartile Range (IQR) | 15.8% | 4.7% |
| Standard Deviation (Sample) | 15.1% | 4.9% |
| Standard Deviation (Population) | 15.0% | 4.8% |
Similar Demographics by Female Poverty
Demographics Similar to Chippewa by Female Poverty
In terms of female poverty, the demographic groups most similar to Chippewa are Guatemalan (16.7%, a difference of 0.030%), Bahamian (16.6%, a difference of 0.36%), Hispanic or Latino (16.6%, a difference of 0.40%), Choctaw (16.8%, a difference of 0.61%), and Immigrants from Central America (16.8%, a difference of 0.67%).
| Demographics | Rating | Rank | Female Poverty |
| Senegalese | 0.0 /100 | #295 | Tragic 16.5% |
| Immigrants | Senegal | 0.0 /100 | #296 | Tragic 16.5% |
| Mexicans | 0.0 /100 | #297 | Tragic 16.5% |
| Somalis | 0.0 /100 | #298 | Tragic 16.6% |
| Hispanics or Latinos | 0.0 /100 | #299 | Tragic 16.6% |
| Bahamians | 0.0 /100 | #300 | Tragic 16.6% |
| Guatemalans | 0.0 /100 | #301 | Tragic 16.7% |
| Chippewa | 0.0 /100 | #302 | Tragic 16.7% |
| Choctaw | 0.0 /100 | #303 | Tragic 16.8% |
| Immigrants | Central America | 0.0 /100 | #304 | Tragic 16.8% |
| Immigrants | Grenada | 0.0 /100 | #305 | Tragic 16.8% |
| Immigrants | Caribbean | 0.0 /100 | #306 | Tragic 16.9% |
| Seminole | 0.0 /100 | #307 | Tragic 16.9% |
| Africans | 0.0 /100 | #308 | Tragic 16.9% |
| Immigrants | Mexico | 0.0 /100 | #309 | Tragic 17.0% |
Demographics Similar to Puget Sound Salish by Female Poverty
In terms of female poverty, the demographic groups most similar to Puget Sound Salish are Welsh (12.7%, a difference of 0.020%), Immigrants from Russia (12.7%, a difference of 0.12%), Canadian (12.7%, a difference of 0.14%), Immigrants from Israel (12.6%, a difference of 0.17%), and Immigrants from Southern Europe (12.7%, a difference of 0.20%).
| Demographics | Rating | Rank | Female Poverty |
| Portuguese | 93.1 /100 | #108 | Exceptional 12.6% |
| Immigrants | Zimbabwe | 93.1 /100 | #109 | Exceptional 12.6% |
| Paraguayans | 93.0 /100 | #110 | Exceptional 12.6% |
| Soviet Union | 92.4 /100 | #111 | Exceptional 12.6% |
| Immigrants | Israel | 92.0 /100 | #112 | Exceptional 12.6% |
| Canadians | 92.0 /100 | #113 | Exceptional 12.7% |
| Welsh | 91.6 /100 | #114 | Exceptional 12.7% |
| Puget Sound Salish | 91.5 /100 | #115 | Exceptional 12.7% |
| Immigrants | Russia | 91.2 /100 | #116 | Exceptional 12.7% |
| Immigrants | Southern Europe | 90.9 /100 | #117 | Exceptional 12.7% |
| Sri Lankans | 90.9 /100 | #118 | Exceptional 12.7% |
| Albanians | 90.8 /100 | #119 | Exceptional 12.7% |
| New Zealanders | 90.6 /100 | #120 | Exceptional 12.7% |
| Immigrants | Hungary | 90.3 /100 | #121 | Exceptional 12.7% |
| French Canadians | 90.2 /100 | #122 | Exceptional 12.7% |