Immigrants from Thailand vs Immigrants from Guatemala Female Poverty Among 25-34 Year Olds
COMPARE
Immigrants from Thailand
Immigrants from Guatemala
Female Poverty Among 25-34 Year Olds
Female Poverty Among 25-34 Year Olds Comparison
Immigrants from Thailand
Immigrants from Guatemala
14.3%
FEMALE POVERTY AMONG 25-34 YEAR OLDS
5.2/ 100
METRIC RATING
218th/ 347
METRIC RANK
16.6%
FEMALE POVERTY AMONG 25-34 YEAR OLDS
0.0/ 100
METRIC RATING
297th/ 347
METRIC RANK
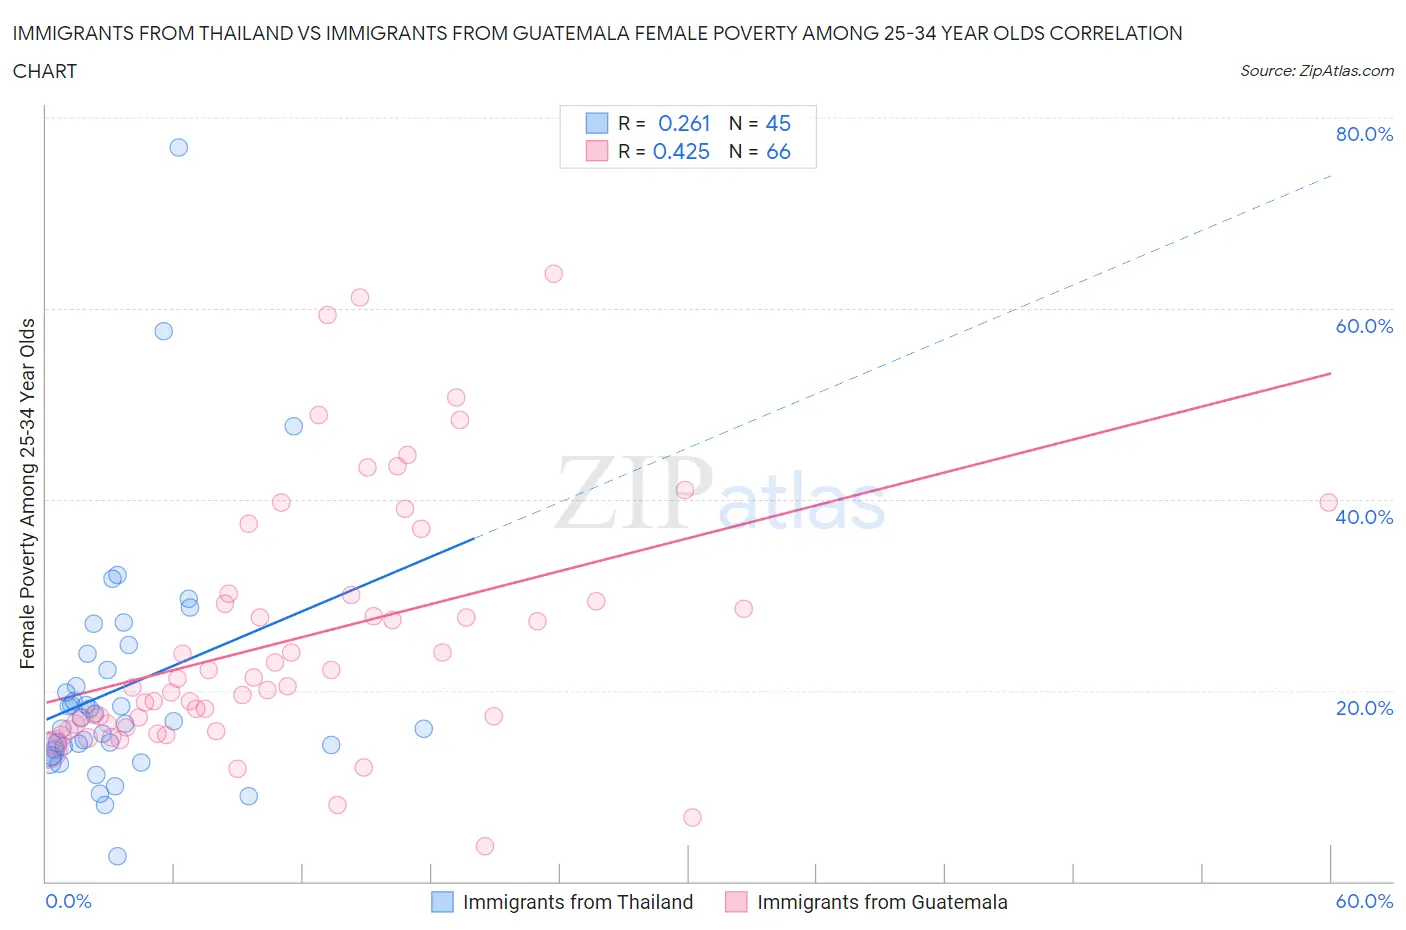
Immigrants from Thailand vs Immigrants from Guatemala Female Poverty Among 25-34 Year Olds Correlation Chart
The statistical analysis conducted on geographies consisting of 313,866,299 people shows a weak positive correlation between the proportion of Immigrants from Thailand and poverty level among females between the ages 25 and 34 in the United States with a correlation coefficient (R) of 0.261 and weighted average of 14.3%. Similarly, the statistical analysis conducted on geographies consisting of 373,350,346 people shows a moderate positive correlation between the proportion of Immigrants from Guatemala and poverty level among females between the ages 25 and 34 in the United States with a correlation coefficient (R) of 0.425 and weighted average of 16.6%, a difference of 15.9%.
Female Poverty Among 25-34 Year Olds Correlation Summary
| Measurement | Immigrants from Thailand | Immigrants from Guatemala |
| Minimum | 2.6% | 3.7% |
| Maximum | 76.9% | 63.6% |
| Range | 74.3% | 60.0% |
| Mean | 20.2% | 25.5% |
| Median | 16.7% | 20.8% |
| Interquartile 25% (IQ1) | 13.8% | 16.5% |
| Interquartile 75% (IQ3) | 23.0% | 30.0% |
| Interquartile Range (IQR) | 9.2% | 13.5% |
| Standard Deviation (Sample) | 13.0% | 13.3% |
| Standard Deviation (Population) | 12.9% | 13.2% |
Similar Demographics by Female Poverty Among 25-34 Year Olds
Demographics Similar to Immigrants from Thailand by Female Poverty Among 25-34 Year Olds
In terms of female poverty among 25-34 year olds, the demographic groups most similar to Immigrants from Thailand are Ecuadorian (14.3%, a difference of 0.0%), French Canadian (14.3%, a difference of 0.11%), Spanish American Indian (14.3%, a difference of 0.11%), Ghanaian (14.4%, a difference of 0.17%), and Sudanese (14.4%, a difference of 0.32%).
| Demographics | Rating | Rank | Female Poverty Among 25-34 Year Olds |
| Trinidadians and Tobagonians | 8.2 /100 | #211 | Tragic 14.2% |
| Immigrants | Guyana | 6.6 /100 | #212 | Tragic 14.3% |
| Puget Sound Salish | 6.5 /100 | #213 | Tragic 14.3% |
| French | 6.2 /100 | #214 | Tragic 14.3% |
| Immigrants | Nigeria | 6.2 /100 | #215 | Tragic 14.3% |
| French Canadians | 5.5 /100 | #216 | Tragic 14.3% |
| Spanish American Indians | 5.5 /100 | #217 | Tragic 14.3% |
| Immigrants | Thailand | 5.2 /100 | #218 | Tragic 14.3% |
| Ecuadorians | 5.2 /100 | #219 | Tragic 14.3% |
| Ghanaians | 4.8 /100 | #220 | Tragic 14.4% |
| Sudanese | 4.4 /100 | #221 | Tragic 14.4% |
| Immigrants | Portugal | 4.3 /100 | #222 | Tragic 14.4% |
| Nigerians | 4.2 /100 | #223 | Tragic 14.4% |
| Immigrants | Sudan | 4.0 /100 | #224 | Tragic 14.4% |
| Immigrants | Barbados | 3.4 /100 | #225 | Tragic 14.5% |
Demographics Similar to Immigrants from Guatemala by Female Poverty Among 25-34 Year Olds
In terms of female poverty among 25-34 year olds, the demographic groups most similar to Immigrants from Guatemala are Hispanic or Latino (16.6%, a difference of 0.060%), Mexican (16.6%, a difference of 0.26%), Immigrants from Central America (16.6%, a difference of 0.33%), Blackfeet (16.7%, a difference of 0.51%), and Spanish American (16.7%, a difference of 0.55%).
| Demographics | Rating | Rank | Female Poverty Among 25-34 Year Olds |
| Indonesians | 0.0 /100 | #290 | Tragic 16.4% |
| Comanche | 0.0 /100 | #291 | Tragic 16.5% |
| Immigrants | Dominica | 0.0 /100 | #292 | Tragic 16.5% |
| Potawatomi | 0.0 /100 | #293 | Tragic 16.5% |
| Immigrants | Central America | 0.0 /100 | #294 | Tragic 16.6% |
| Mexicans | 0.0 /100 | #295 | Tragic 16.6% |
| Hispanics or Latinos | 0.0 /100 | #296 | Tragic 16.6% |
| Immigrants | Guatemala | 0.0 /100 | #297 | Tragic 16.6% |
| Blackfeet | 0.0 /100 | #298 | Tragic 16.7% |
| Spanish Americans | 0.0 /100 | #299 | Tragic 16.7% |
| U.S. Virgin Islanders | 0.0 /100 | #300 | Tragic 16.7% |
| Immigrants | Congo | 0.0 /100 | #301 | Tragic 16.7% |
| Alaska Natives | 0.0 /100 | #302 | Tragic 16.8% |
| Immigrants | Mexico | 0.0 /100 | #303 | Tragic 16.8% |
| Hondurans | 0.0 /100 | #304 | Tragic 16.9% |